An open, honest record of our Sicily wildfire-detection science — methods, results, negatives, and limits.
🇮🇹🇬🇧 New — see the full breakdown yourself: what actually causes Sicilian wildfires, province by province
All 9 provinces, 391 comuni, 23 years of independent satellite fire data — an interactive map and tables you can click into, filter, and check against the official narrative. Draw your own conclusions on what's measured versus what's assumed. Includes the full independent case study behind it.
Bottom line up front. This is PHOENIX's open research
log: the methods we use to detect Sicilian wildfires from satellites and ground sensors,
and what we've learned building and testing them. It is deliberately honest — negative
results, corrections, and preliminary findings are recorded as first-class entries,
because a detection system you can trust is one whose limits are stated plainly. Each entry
gives a plain-language summary, then the technical methodology and its caveats. PHOENIX is a
small grassroots effort; nothing here is a guarantee of detection, and operational claims are
gated behind validation.
Reproducibility & literature standard. Every entry below carries a plain-language analogy, a Claim status tag (SUPPORTED / NEGATIVE / CORRECTED / EXPLORATORY), and a Current literature & PHOENIX alignment block stating whether our result agrees with the peer-reviewed literature or disproves/diverges from it — with numbered, linked references so anyone can verify or reproduce the test. Method, data and code are linked per entry where applicable. Last rigor pass: 2026-06-28.
What PHOENIX is — and what it owns. We operate no satellites
and field no sensors of our own. We are not funded or scoped to launch or maintain space
hardware, and we don't need to be: every observation in this log comes from instruments other
people built, launched and pay to operate — EUMETSAT (SEVIRI / FCI / MTG), NASA & NOAA
(VIIRS / MODIS, via FIRMS), ESA (Sentinel-1 / 2 / 3) and others. PHOENIX's entire contribution is
processing: uniquely combining, re-deriving and cross-checking those public feeds to pull
fires out faster, more precisely, and with more confidence than the raw products give. Throughout
this log, when an entry says “our detector,” it means our algorithm running on
someone else's pixels — never hardware we own. The one place that changes is the ground:
PHOENIX's own ground sensors are a deliberate future pillar, not yet fielded — until
then we benefit entirely from everyone else's expenditure on orbit.
This research is yours too. ADRIZ builds in the open — the wins, the dead ends, all of it. Read it, question it, and help steer where we go next. Open the Comments on this entry panel under any individual entry (or the section-level Discuss this thread panel) to share an idea, push back on a result, or ask why we did something. If we've misread what you meant, reply and set us straight — that back-and-forth is exactly how this gets better. Add your name to be credited, or stay anonymous. You're part of this.
The mission & our honest scorecard
What PHOENIX is for — and how we grade ourselves, reporting wins together with their limits.
The analogy. The project's north star, in plain terms: get wildfire warnings to ordinary citizens faster, more precisely located, and with more certainty it's a real fire than anyone else — sub-pixel heat detection is just one tool toward that, not the goal itself. The standing rule is to report wins honestly so no one has reason to dismiss a PHOENIX alert as low quality.
PHOENIX's foundational goal, in ADRIZ's own words: "Our goal is to be better, faster, and more accurate than everyone else at delivering this information to the citizens. Through specialized processing we will combine, develop, and innovate ways to deliver wildfire smoke, flame, pre-ignition, or other signals before others, with greater precision on location, and with a higher confidence and assurance that it is an actual fire."
This corrects the too-narrow framing of PHOENIX as "sub-pixel thermal extraction out of SEVIRI/FCI" — sub-pixel is ONE mechanism, not the goal. Decomposed:
End objective: deliver wildfire information TO citizens, better than anyone else — so the citizen app, public site, and alerting are core performance surface.
Signals in scope (all of them): smoke, flame, pre-ignition/precursor signals (fuel moisture, FWI, lightning priors, ignition forecasting), and explicitly "other signals" — open-ended, invent new ones.
Method: specialized processing — combine, develop, innovate; multi-modal fusion across every available source; don't merely replicate FIRMS/EUMETSAT/MODIS/SLSTR.
Three pillars of "better": (1) faster — deliver before others; (2) greater location precision; (3) higher confidence it's an ACTUAL fire (real-bogus, fewer false alarms).
What PHOENIX owns — and doesn't. PHOENIX operates no satellites and, as of this writing, fields no sensors of its own. We are not funded or scoped to launch or maintain space hardware — and we don't need to be: every signal we use comes from instruments other people built, launched, and pay to operate (EUMETSAT's SEVIRI/FCI/MTG, NASA/NOAA's VIIRS/MODIS via FIRMS, ESA's Sentinel-1/2/3, and others). Our entire edge is processing — uniquely combining, re-deriving, and cross-validating those public feeds. Throughout this log, "our detector" means *our algorithm running on someone else's data*, never hardware we own. The one place that changes is the ground: PHOENIX's own ground sensors (Alessandria della Rocca and beyond [0012][0013]) are a deliberate future pillar — until they are fielded, we benefit entirely from others' expenditure on orbit. This is a strength, not an apology: we stand on the whole world's Earth-observation investment and compete only where we can actually win, in the processing.
Posture: a long-horizon goal with abundant resources to build on. The external voice stays humble and partnership-framed (credit FIRMS/EUMETSAT; "the teammate to have"), while the internal bar is relentlessly "have the best." The quality bar is that the larger fire-detection community never has to ignore a PHOENIX delivery because it is lower quality than what someone else already has — which is why honest, de-inflated win-reporting matters.
Claim status: SUPPORTED.
Current literature & PHOENIX alignment.Verdict: descriptive infrastructure/goal statement — no experimental claim to reconcile.
What the external literature reinforces: Data provenance is third-party (EUMETSAT [8], NASA FIRMS [10]); PHOENIX's differentiator is fusion of citizen + satellite + ground evidence, not satellite ownership.
Where PHOENIX is stricter or diverges: Operational readiness (fresh ingest, healthy public surfacing) is separate from scientific validity and is tracked as first-class engineering evidence.
What this post does not claim: An inventory or goal statement is not a performance result.
Next research test: Maintain a live health table (per-feed last product, candidate-table last insert, public last event, stalled queues, failed units) and require proof-of-recovery after every ingest repair.
Public data sources:EUMETSAT Data Store MSG-SEVIRI L1.5 · EUMETSAT Data Store MTG-FCI L1c / FCI-AF L2 · NASA FIRMS active-fire archive + area API (VIIRS/MODIS/SLSTR truth). Every figure in this entry is reproducible from these public sources with no access to PHOENIX infrastructure; the method is stated above and in any linked code.
Statistical reporting: proportions are quoted with Wilson 95% confidence intervals and ranking metrics (AUC) with bootstrap 95% CIs; read the interval and the sample size n, not the point estimate. A shuffled-label placebo (≈0.5) accompanies learned separability claims.
Date: 2026-06-13 Status: defensible (accepted baseline; "build up from here")
The analogy. Picture grading a search-and-rescue dog by demanding it bark at the exact second a hiker fell, versus crediting it for finding the right spot — switching to "did it find the location" turned an apparent total failure into a near-perfect 99.8% find rate. The honest scorecard: PHOENIX reliably locates fires, but still raises too many false alarms and hasn't yet proven it's faster than the existing system.
PHOENIX established an honest, accepted satellite mission-eval baseline after fixing the evaluation harness. The old eval scored real hits as misses because it demanded a detection match a fire's exact minute, but confirmed truth comes from Sentinel-2 burn scars whose timestamp is location-true / time-approximate. Matching on LOCATION (4 km, time-loose) instead flipped gold recall from ~0 to ~99.8%.
Baseline scores (event-level, confidence sweep):
| Detector | gold recall | precision | median lead vs FIRMS | note |
|---|---|---|---|---|
| subpixel_v1_alpha_retro | 99.8% | 38% | negative (later) | finds all fire locations; too many false alarms; no time edge in this measure |
| s2_primary_v1_alpha | 16% | 73% | later | precise but low recall |
Honest read: PHOENIX reliably LOCATES fires, but (a) the fast detector's false-alarm rate is too high and (b) it was not yet measurably faster than FIRMS on the naive metric. The earlier "+624 min before FIRMS / 1687 sole catches" figure was shown to be an over-firing/subset artifact and was corrected. ADRIZ accepted this as the baseline ("that is our score… we build on it and build up"), with the build-up plan being: cut false alarms without losing near-total recall, then win lead-time. Harness: `sat_mission_eval_v3.py` / `sat_mission_eval_v3b_precision.py`.
Claim status: SUPPORTED.
Current literature & PHOENIX alignment.Verdict: our finding AGREES with the literature, and disproves the 'bigger model breaks the floor' framing. Recent DL fire-detection reviews conclude that sensor spatial/temporal/spectral limits — not model capacity — set the ceiling [1].
What the external literature reinforces: The reviews [1] and the MTG-FCI results [5] both treat geostationary imagery as a high-cadence candidate/event source, not a high-confidence per-pixel detector — exactly PHOENIX's position.
Where PHOENIX is stricter or diverges: Where challenger architectures are promoted by reputation (e.g. HybriDet [4]), we require they beat our incumbents on our own SEVIRI-vs-FIRMS data before adoption; on that data many architectures hit the same ~13-18% recall ceiling, which is a property of the 3 km sensor.
What this post does not claim: No SEVIRI-only model should be presented as a precise final detector; the floor is architecture-invariant, so a negative deep-learning result is evidence about the sensor, not about the network.
Next research test: Run the raw 12-channel SEVIRI / 16-channel FCI brightness-temperature vector (not only derived features) at matched alert budgets (500-50000); separate candidate-generation value from final-detector precision; quarantine small-sample results until large-sample replication.
Public data sources:EUMETSAT Data Store MSG-SEVIRI L1.5 · EUMETSAT Data Store MTG-FCI L1c / FCI-AF L2 · NASA FIRMS active-fire archive + area API (VIIRS/MODIS/SLSTR truth). Every figure in this entry is reproducible from these public sources with no access to PHOENIX infrastructure; the method is stated above and in any linked code.
Statistical reporting: proportions are quoted with Wilson 95% confidence intervals and ranking metrics (AUC) with bootstrap 95% CIs; read the interval and the sample size n, not the point estimate. A shuffled-label placebo (≈0.5) accompanies learned separability claims.
The analogy. A single day's shipping manifest: nine fire-detection parts rolled out at once, most running quietly in the background until they prove themselves. Tellingly, every tuning experiment that day came up empty, confirming the real bottleneck isn't the software dials but the blurry resolution of the satellite itself.
In a single ship day PHOENIX deployed 9 detection-stack components to the DGX pipeline:
1. subpixel_v1 FRP correction — canonical Stefan–Boltzmann T⁴ (σ_SB = 5.6704e-8) — LIVE, with transparency-page + change-log entries.
2. dozier_v1 bi-spectral sub-pixel solver (fsolve + brentq) — LIVE parallel-emit; tests 5/5 PASS; 1000 K/0.01 km² → 562.7 MW.
3. LST resampler (LSA-SAF → SEVIRI/FCI grid, ~220× speedup) — LIVE; 853/904 SEVIRI + 534/540 FCI frames augmented.
4. Multi-sensor voter (≥2-source coincidence, ±30 min / ±5 km) — LIVE; 18 voted events in a 7-day backfill (1.24% rate).
5. FIRMS-anchored prior (relax gate at FIRMS lat/lon ±1 px for 90 min) — SHADOW; 2 TP / 0 FP in a 14-day backfill.
6. Persistence gate (multi-frame, per-env tolerance) — SHADOW; HOLD verdict (+4.11 pp precision but 33% recall loss, below ship bars).
7. Sat thermal validator (conformal singleton, α=0.01) — LIVE; 65.7% validation coverage at 100% precision.
8. Triage UI at adr-wildfire.com/triage (Basic Auth) — LIVE; daily flywheel cron feeds the hard-negative dataset.
9. Prod tree → private GitHub backup — LIVE; auto-push on every commit.
Three gate sweeps ran the same day (SEVIRI LST-augmented, FCI LST-augmented, and a historical 2026-04-23..06-05 retrospective) — all returned NO-WINNER verdicts, confirming the binding constraint is the SEVIRI 3 km / FCI 2 km IFOV physical sensitivity floor (best FCI precision 4.149e-03, ~200× below the 0.80 ship bar), not gate tuning. The morning hypothesis that detections were in the wrong SEVIRI pixels was falsified that evening (projection traced correct to within 1.6 km). Forward paths carried (not shipped): MTG-FCI 2 km, dozier_v1 inversion, candidate-level multi-frame persistence, VIIRS/MODIS-anchored prior expansion.
Claim status: SUPPORTED.
Current literature & PHOENIX alignment.Verdict: descriptive infrastructure/goal statement — no experimental claim to reconcile.
What the external literature reinforces: Data provenance is third-party (EUMETSAT [8], NASA FIRMS [10]); PHOENIX's differentiator is fusion of citizen + satellite + ground evidence, not satellite ownership.
Where PHOENIX is stricter or diverges: Operational readiness (fresh ingest, healthy public surfacing) is separate from scientific validity and is tracked as first-class engineering evidence.
What this post does not claim: An inventory or goal statement is not a performance result.
Next research test: Maintain a live health table (per-feed last product, candidate-table last insert, public last event, stalled queues, failed units) and require proof-of-recovery after every ingest repair.
Public data sources:EUMETSAT Data Store MSG-SEVIRI L1.5 · EUMETSAT Data Store MTG-FCI L1c / FCI-AF L2 · NASA FIRMS active-fire archive + area API (VIIRS/MODIS/SLSTR truth). Every figure in this entry is reproducible from these public sources with no access to PHOENIX infrastructure; the method is stated above and in any linked code.
Statistical reporting: proportions are quoted with Wilson 95% confidence intervals and ranking metrics (AUC) with bootstrap 95% CIs; read the interval and the sample size n, not the point estimate. A shuffled-label placebo (≈0.5) accompanies learned separability claims.
entry 0010
Sole-reporter confirmation rate — full-scale defensible result
Date: 2026-06-14 Status: defensible (full-scale, with caveats)
The analogy. When PHOENIX is the only one to spot a fire that no other satellite saw, how often is it actually real? Checked against burn scars and ground reports over seven weeks, the answer lands between 79% and 96.5% — an honest range, not a single inflated number, and an earlier "100%" claim was walked back.
PHOENIX measured how often its "sole-reporter" detections — fires PHOENIX saw that no independent VIIRS/MODIS/SLSTR pass corroborated within 7 km / 12 h — were later confirmed real. Over PHOENIX's full ~7-week record (2026-04-26 → 06-14; the project has no detection history before 2026-04-26), of 6,690 PHOENIX-led detections, 5,563 (83.2%) were truly sole-reporter (the earlier "100% sole" claim was overstated; ~17% had a polar pass nearby).
After maximizing post-hoc verification coverage (PHOENIX's own Sentinel-2 dNBR engine via Microsoft Planetary Computer, plus local VVF/ANSA/SAR), the unverifiable fraction dropped from ~46% to 13.2%. Results (bootstrap 2000×, 95% CI):
P1 (confirmed of hard-adjudicable) = 96.5% [95.9, 97.0] — the headline, hard signals only.
P2 (confirmed of S2-tested) = 78.9% [77.7, 80.1] — conservative floor, counting every S2 no-scar against PHOENIX.
The true rate lies between P1 and P2; the gap is the NO_BURN_S2 bucket (dNBR median 0.049, just below the 0.10 scar floor) — weak/partial scars consistent with small/grass fires, concentrated in `wind_diff`, not clean false positives. Per-detector P1: fci_l1c 99.8%, subpixel 92.9%, wind_diff 94.9%. Discipline: the population is large (tight CIs) but the time span is fixed at 7 weeks, and no per-AOI claim is made for thin/cloud-blocked areas (e.g. ADR n=131 reads P1 100% but only 59 adjudicable). The irreducible band (78.9–96.5%) is where Gaetano's ground sensor + citizen reports become the missing field truth.
Claim status: SUPPORTED.
Current literature & PHOENIX alignment.Verdict: AGREEMENT — multi-sensor fusion and event-based confirmation are exactly the directions the current literature endorses.
What the external literature reinforces: High-temporal multi-source fusion [2] and FCI event tracking [5][7] support cross-instrument confirmation; PHOENIX adds the operational 'confirm-up only' rule.
Where PHOENIX is stricter or diverges: Agreement between two sensors confirms strongly, but coverage is partial (only a fraction of fires are co-observed), so absence of a second sensor must never reject a candidate.
What this post does not claim: Multi-sensor precision figures (~99%) apply only to the subset of fires multiple sensors happen to see; they are not a system-wide recall claim.
Next research test: Wire higher-cadence FCI/SLSTR/MODIS into the voter; quantify the co-observation coverage fraction per fire class; add provenance/source-independence audits to the corroboration logic.
Public data sources:NASA FIRMS active-fire archive + area API (VIIRS/MODIS/SLSTR truth) · EUMETSAT Data Store MSG-SEVIRI L1.5 · EUMETSAT Data Store MTG-FCI L1c / FCI-AF L2 · Copernicus Data Space Sentinel-3 SLSTR. Every figure in this entry is reproducible from these public sources with no access to PHOENIX infrastructure; the method is stated above and in any linked code.
Statistical reporting: proportions are quoted with Wilson 95% confidence intervals and ranking metrics (AUC) with bootstrap 95% CIs; read the interval and the sample size n, not the point estimate. A shuffled-label placebo (≈0.5) accompanies learned separability claims.
entry 0016
Delivery-clock lead time — PHOENIX SEVIRI detectors deliver ahead of FIRMS VIIRS
Date: 2026-06-14 Status: defensible (delivery clock), with detector-specific caveats
Correction (2026-09-17). The delivery-clock lead below measured FIRMS publishing delay, not PHOENIX speed, and the 1,740 to 31 "real wins" were scored against a truth layer later found unsound. Do not cite these figures. See 0124.
The analogy. Measured by when a warning actually reaches people, PHOENIX's always-watching geostationary detectors deliver minutes after a fire versus hours for the polar-orbiting system that has to fly overhead — a roughly 2-to-7-hour head start. But the team is disciplined: some detectors are NOT faster, those claims are dropped, and over 1,700 inflated "wins" were thrown out to keep only the 31 real ones.
PHOENIX established a defensible "earlier than FIRMS" claim on the DELIVERY clock — the time a detection actually reaches the citizen (measured from real `ingested_at` minus sensing timestamp), among co-detected cell-day fire events. This superseded an earlier −601-minute figure that was shown to be a measurement artifact (the retro ran daytime-only SEVIRI and paired across calendar days, structurally unable to beat FIRMS NOAA-20's ~00–02h UTC night overpass).
Measured comparator delivery latencies (median): FIRMS VIIRS ~513–560 min (~9 h), FIRMS MODIS ~387 min, SLSTR ~461 min, FCI-L2 ~23.5 min, ground vigili_fuoco ~0 min. PHOENIX delivery latencies (median): wind_diff 0.2 min, subpixel_v1_alpha 0.6 min (SEVIRI geostationary ≈ near-instant), fci_l1c ~240 min, s2_swir ~1225 min (~20 h).
Defensible lead results: PHOENIX subpixel_v1 vs VIIRS = +424 min / 80% PHOENIX-first (n=10, confirms a prior +414/80%); fci_l1c vs VIIRS = +129 min / 72% (n=43, most statistically robust). Honest caveats kept: `wind_diff` vs VIIRS = −58 min / 45% — NOT defensibly earlier, do not claim. And `s2_swir` (~20 h delivery) is SLOWER than FIRMS VIIRS (~9 h), so per-fire s2_swir lead claims are false on the delivery clock. The defensible public "we're faster than FIRMS-VIIRS" story is SEVIRI subpixel + fci_l1c only. An honest-wins reporter vets every public win claim with 5 gates (dedup to one fire event, require multi-family corroboration, both sensing+delivery clocks, same-sensor → sensitivity-not-speed, wind_diff guardrail), dropping ~1,740 overclaims from a recent 3-week window down to 31 real delivery-lead speed wins.
Claim status: SUPPORTED.
Current literature & PHOENIX alignment.Verdict: strong AGREEMENT — the newest 2025-2026 FCI literature directly corroborates PHOENIX's FCI-first strategy.
What the external literature reinforces: Xu et al. [5] report MTG-FCI detects fires earlier and finds many more active-fire pixels than SEVIRI, with improved small-fire FRP; Paugam et al. [6][7] derive fire-arrival maps, rate-of-spread and persistent event IDs from FCI — the event-tracking direction PHOENIX has queued; EUMETSAT [8] confirms the operational mandate.
Where PHOENIX is stricter or diverges: Literature reports the instrument's potential; PHOENIX additionally requires demonstrable ingest freshness (latest product timestamp, candidate-creation proof) before any operational claim — a system-health condition the papers do not address.
What this post does not claim: FCI should not be framed merely as a SEVIRI replacement, nor as operational while ingest is stale; it is an event tracker, early-detection source, FRP/ROS source and fusion input.
Next research test: Build the FCI event tracker (space-time clustering, persistent IDs, FRP time-series, growth direction); add a time-to-first-candidate metric per real event; compare against FIRMS/VIIRS/MODIS/SLSTR and EFFIS/Copernicus EMS perimeters.
Public data sources:EUMETSAT Data Store MTG-FCI L1c / FCI-AF L2 · EUMETSAT Data Store MSG-SEVIRI L1.5 · NASA FIRMS active-fire archive + area API (VIIRS/MODIS/SLSTR truth). Every figure in this entry is reproducible from these public sources with no access to PHOENIX infrastructure; the method is stated above and in any linked code.
Statistical reporting: proportions are quoted with Wilson 95% confidence intervals and ranking metrics (AUC) with bootstrap 95% CIs; read the interval and the sample size n, not the point estimate. A shuffled-label placebo (≈0.5) accompanies learned separability claims.
entry 0017
Three measurements this project got wrong, and how each was caught
Date: 2026-09-05 Status: SUPPORTED (published as a negative result; see the standing rule on reporting limits with wins)
The analogy. An instrument that has never been checked against a known quantity is not a measurement, it is an opinion with a decimal point.
BLUF. Three numbers produced in the course of this work were wrong, and all three failed in the same direction: the check could not have reported the bad state.
First. A survey asserted on HTTP status codes and reported zero authentication failures across seven public surfaces while a watermarked basemap was live on one of them. Status codes cannot see a refusal painted into an image.
Second. A watermark detector was calibrated on six sample tiles, passed, and then silently stopped detecting the very provider it was built for when the sample grew to twelve — because the statistic it used, pixel-level identity, degrades as the backgrounds vary. It was caught only because the tool carries a self-test that asserts known-bad providers still read as bad.
Third. An alert-latency measurement reported a median delay of ten hours. The query built its time bounds with a space between date and time while the stored timestamps use T; in string comparison a space sorts before T, so every same-date detection was silently excluded and only stale ones remained in range. The figure was an artefact of a separator. It is being re-measured.
Method note. The common thread is not carelessness about arithmetic. In each case the check ran, returned a clean-looking answer, and had no path by which it could have returned the true one. The discipline that catches this is asking, before believing a green result, what would have to be true for this check to fail — and then arranging for that state to exist and confirming the check reports it.
Seeing the fire: detection physics & the sensitivity floor
How we pull a fire out of a satellite pixel — and the hard physical ceiling on the smallest fire we can see.
subpixel_v1 FRP formula — Wooster audit (non-canonical T⁸ formula found and corrected)
Date: 2026-06-05 Status: correction shipped (defensible after patch)
The analogy. Imagine a recipe that calls for cubing a number when it should have squared it — the dish came out roughly 20 times too small at one setting and wildly too large at another. PHOENIX found its fire-power formula had the wrong exponent baked in, publicly corrected it, and admitted the old "matches the textbook" claim had been false.
PHOENIX's `subpixel_v1` Fire Radiative Power (FRP) estimator was audited and the live formula `_wooster_frp_mw` was confirmed WRONG: it used a non-canonical `FRP = σ · A_pix · (T⁸_fire − T⁸_bg)` form with σ=1.89e-19, instead of the canonical Wooster Stefan–Boltzmann pixel-integrated form `FRP = A_fire · σ_SB · (T⁴_fire − T⁴_bg)` with σ_SB = 5.6704e-8. An earlier 2026-05-25 fix had only patched the constant (from 1.89e-7), never the wrong T⁸ exponent.
Synthetic test (1000 K fire / 0.01 km² in a 3 km² SEVIRI pixel): canonical Wooster gives 563 MW; the old PHOENIX function gave 28.6 MW (~20× under at fire-temperature inputs), while in the 295–315 K band PHOENIX actually operated in it over-predicted canonical by ~7×. The retraction scope was narrow: live `/api/detections` was returning zero `subpixel_v1_alpha` rows at the time, and served FRP came from `wind_diff` and `fci_l1c` paths that do not use the audited formula.
The transparency page had publicly asserted "FRP matches Wooster-2005 to within numerical precision," which was false even after the May patch. On 2026-06-05 the formula was corrected to the canonical Stefan–Boltzmann T⁴ form (σ_SB = 5.6704e-8), shipped with the transparency-page amendment and a `/change-log` entry per the no-quiet-corrections policy.
Claim status: CORRECTED / SUPERSEDED.
Current literature & PHOENIX alignment.Verdict: our finding AGREES with the literature, and disproves the 'bigger model breaks the floor' framing. Recent DL fire-detection reviews conclude that sensor spatial/temporal/spectral limits — not model capacity — set the ceiling [1].
What the external literature reinforces: The reviews [1] and the MTG-FCI results [5] both treat geostationary imagery as a high-cadence candidate/event source, not a high-confidence per-pixel detector — exactly PHOENIX's position.
Where PHOENIX is stricter or diverges: Where challenger architectures are promoted by reputation (e.g. HybriDet [4]), we require they beat our incumbents on our own SEVIRI-vs-FIRMS data before adoption; on that data many architectures hit the same ~13-18% recall ceiling, which is a property of the 3 km sensor.
What this post does not claim: No SEVIRI-only model should be presented as a precise final detector; the floor is architecture-invariant, so a negative deep-learning result is evidence about the sensor, not about the network.
Next research test: Run the raw 12-channel SEVIRI / 16-channel FCI brightness-temperature vector (not only derived features) at matched alert budgets (500-50000); separate candidate-generation value from final-detector precision; quarantine small-sample results until large-sample replication.
Public data sources:EUMETSAT Data Store MSG-SEVIRI L1.5 · EUMETSAT Data Store MTG-FCI L1c / FCI-AF L2 · NASA FIRMS active-fire archive + area API (VIIRS/MODIS/SLSTR truth). Every figure in this entry is reproducible from these public sources with no access to PHOENIX infrastructure; the method is stated above and in any linked code.
Statistical reporting: proportions are quoted with Wilson 95% confidence intervals and ranking metrics (AUC) with bootstrap 95% CIs; read the interval and the sample size n, not the point estimate. A shuffled-label placebo (≈0.5) accompanies learned separability claims.
entry 0001
dozier_v1 — bi-spectral sub-pixel fire solver shipped
The analogy. Like solving for two unknowns from two clues, this method reads a fire's faint heat in two infrared colors at once to back out how hot it is and how big it is, even when the fire is far smaller than a single pixel — and on a known test case it landed right on the textbook answer.
PHOENIX shipped `dozier_v1`, a bi-spectral (Dozier) sub-pixel fire solver that inverts paired MIR/TIR brightness temperatures to recover the sub-pixel fire temperature, fire fractional area, and FRP. The implementation (`src/detectors/dozier_v1.py`, ~415 lines) uses `fsolve` + `brentq` numerical root-finding with environment-keyed band selection.
Validation: the unit-test suite passes 5/5, and on the canonical synthetic case (1000 K fire / 0.01 km² in a SEVIRI pixel) it returns 562.7 MW — consistent with the canonical Wooster Stefan–Boltzmann benchmark (563 MW), confirming the inversion is physically grounded. It runs LIVE in parallel-emit mode alongside `subpixel_v1`. A 72-hour `dozier_v1` vs `subpixel_v1` shadow comparison was scheduled. The detector recovers `(T_fire, A_fire, FRP)` whenever the upstream LST gate next admits a candidate, so its yield is bounded by the same SEVIRI/FCI sensitivity floor as the rest of the thermal stack.
Claim status: SUPPORTED.
Current literature & PHOENIX alignment.Verdict: our finding AGREES with the literature, and disproves the 'bigger model breaks the floor' framing. Recent DL fire-detection reviews conclude that sensor spatial/temporal/spectral limits — not model capacity — set the ceiling [1].
What the external literature reinforces: The reviews [1] and the MTG-FCI results [5] both treat geostationary imagery as a high-cadence candidate/event source, not a high-confidence per-pixel detector — exactly PHOENIX's position.
Where PHOENIX is stricter or diverges: Where challenger architectures are promoted by reputation (e.g. HybriDet [4]), we require they beat our incumbents on our own SEVIRI-vs-FIRMS data before adoption; on that data many architectures hit the same ~13-18% recall ceiling, which is a property of the 3 km sensor.
What this post does not claim: No SEVIRI-only model should be presented as a precise final detector; the floor is architecture-invariant, so a negative deep-learning result is evidence about the sensor, not about the network.
Next research test: Run the raw 12-channel SEVIRI / 16-channel FCI brightness-temperature vector (not only derived features) at matched alert budgets (500-50000); separate candidate-generation value from final-detector precision; quarantine small-sample results until large-sample replication.
Public data sources:EUMETSAT Data Store MSG-SEVIRI L1.5 · EUMETSAT Data Store MTG-FCI L1c / FCI-AF L2 · NASA FIRMS active-fire archive + area API (VIIRS/MODIS/SLSTR truth). Every figure in this entry is reproducible from these public sources with no access to PHOENIX infrastructure; the method is stated above and in any linked code.
Statistical reporting: proportions are quoted with Wilson 95% confidence intervals and ranking metrics (AUC) with bootstrap 95% CIs; read the interval and the sample size n, not the point estimate. A shuffled-label placebo (≈0.5) accompanies learned separability claims.
entry 0002
SEVIRI physical sensitivity floor — the binding constraint on thermal detection
Date: 2026-05-22 (confirmed across later gate sweeps) Status: defensible (physics floor)
The analogy. PHOENIX hit a hard ceiling set by physics, not programming: its main geostationary satellite simply can't run hot enough in a 3 km pixel to register a small fire the way a sharper-eyed satellite can — like trying to read fine print through a frosted window. No amount of tuning fixes this; only better-resolution instruments and sensor fusion can, which is where the real gains came from.
PHOENIX confirmed that the binding constraint on its geostationary thermal detection is the instrument's physical sensitivity floor, not algorithm or threshold tuning. Backtesting against VIIRS-confirmed fires showed the SEVIRI mid-infrared (MIR) brightness temperature 99th percentile peaks around 305 K and never reaches the ~320 K absolute fire-detection floor — so SEVIRI alone cannot beat FIRMS-VIIRS on small fires; reaching them requires MTG-FCI (2 km) and Sentinel-2 SWIR (20 m).
This floor is reaffirmed by repeated no-winner gate sweeps: on a 2026-06-05 sweep, the hottest MIR pixel in a representative frame was 312.98 K (below the 320 K floor), and 12–15 threshold configurations across LST-augmented SEVIRI and FCI corpora produced no shippable winner (best FCI precision 4.149e-03, ~200× below the 0.80 ship bar). The detector-level conclusion (later confirmed by the n=752 localization audit) is that the detections sit in the correct SEVIRI pixels; those pixels are simply, correctly, not hot enough at SEVIRI's 3 km / FCI's 2 km IFOV versus a VIIRS 375 m sub-pixel fire.
Implication: the lever is not more threshold sweeping (a documented dead end) but better resolution (FCI 2 km, S2 SWIR 20 m), sub-pixel inversion (dozier_v1), multi-sensor fusion, and richer per-candidate features (contextual background tests, terrain morphology) — which is exactly where the false-alarm-reduction and FCI-inclusion work delivered gains.
Claim status: SUPPORTED.
Current literature & PHOENIX alignment.Verdict: our finding AGREES with the literature, and disproves the 'bigger model breaks the floor' framing. Recent DL fire-detection reviews conclude that sensor spatial/temporal/spectral limits — not model capacity — set the ceiling [1].
What the external literature reinforces: The reviews [1] and the MTG-FCI results [5] both treat geostationary imagery as a high-cadence candidate/event source, not a high-confidence per-pixel detector — exactly PHOENIX's position.
Where PHOENIX is stricter or diverges: Where challenger architectures are promoted by reputation (e.g. HybriDet [4]), we require they beat our incumbents on our own SEVIRI-vs-FIRMS data before adoption; on that data many architectures hit the same ~13-18% recall ceiling, which is a property of the 3 km sensor.
What this post does not claim: No SEVIRI-only model should be presented as a precise final detector; the floor is architecture-invariant, so a negative deep-learning result is evidence about the sensor, not about the network.
Next research test: Run the raw 12-channel SEVIRI / 16-channel FCI brightness-temperature vector (not only derived features) at matched alert budgets (500-50000); separate candidate-generation value from final-detector precision; quarantine small-sample results until large-sample replication.
Public data sources:EUMETSAT Data Store MSG-SEVIRI L1.5 · EUMETSAT Data Store MTG-FCI L1c / FCI-AF L2 · NASA FIRMS active-fire archive + area API (VIIRS/MODIS/SLSTR truth). Every figure in this entry is reproducible from these public sources with no access to PHOENIX infrastructure; the method is stated above and in any linked code.
Statistical reporting: proportions are quoted with Wilson 95% confidence intervals and ranking metrics (AUC) with bootstrap 95% CIs; read the interval and the sample size n, not the point estimate. A shuffled-label placebo (≈0.5) accompanies learned separability claims.
entry 0018
The finer band that doesn't help — testing FCI's short-wave channel as a standalone fire-finder
Date: 2026-06-23 Status: refuted (eval; zero independent recall gain — no integration)
The analogy. Our main fire-detecting heat band on the geostationary satellite sees the world in two-kilometre squares; a different, shorter-wavelength band sees it in sharper one-kilometre squares. It was tempting to think the sharper band might catch small fires the main band misses. We tested it directly against the fires we miss — and it caught nothing the main band didn't already catch. Sharper, it turns out, is not the same as more sensitive.
BLUF. We already use the satellite's short-wave-infrared (SWIR) channels as a *confirmation* signal — but only on fires our main mid-infrared (MIR) detector has already flagged. The open question was whether SWIR, which is sampled at a finer one kilometre versus the MIR's two, could work as a *standalone* detector and recover small daytime fires the MIR floor misses. We ran the test on 50 real missed fires (confirmed by the polar satellites, missed by our own detectors) plus 80 clear non-fire control points. The SWIR hotspot index flagged 14% of the misses; the MIR flagged 30% of the same misses; and the fires SWIR caught were entirely a subset of the ones MIR caught — the independent gain from SWIR was exactly zero, at zero false positives. Promoting SWIR to a primary detector would add no recall. The physics is the reason: at this resolution the SWIR bands only light up for very hot or large flaming fronts that the MIR already sees easily, and their finer sampling does not overcome their lower sensitivity to the moderate sub-pixel fires that make up the population we miss.
Method. The miss set was every daytime polar-confirmed Sicily fire since 13 June with no real internal detector (our MIR sub-pixel, FCI, or Dozier detector) within five kilometres and forty-five minutes. For each, we pulled the nearest geostationary granule, loaded the two SWIR bands and the MIR band the pipeline reads, and computed the Normalized Hotspot Index (the standard sub-pixel hotspot measure) and the MIR temperature anomaly, each against a local background ring. A point counted as a SWIR detection if its hotspot index rose more than three robust standard deviations above background; as a MIR detection on the same rule for temperature. Controls were random daytime points with no fire of any kind nearby, to measure the false-positive cost. Read-only; nothing shipped.
Why it's a clean negative. Three things make this decisive rather than method-limited. First, the gain is *zero*, not merely small — SWIR never fired where MIR did not, so there is no threshold to tune that would rescue it. Second, the false-positive rate is also zero, so we are not trading away recall for noise; SWIR is simply blind to these fires. Third, it matches the established physics of our floor [0018]: the binding constraint is MIR sensitivity, and the path to smaller fires runs through genuinely higher-resolution instruments (Sentinel-2 SWIR at twenty metres), not through a coarser geostationary SWIR. One incidental finding worth a follow-up: the MIR anomaly flagged 30% of these "misses," meaning a weak MIR signal is present that our production gate rejects — a hint that the MIR gate itself, not a new band, is where recall might still be won.
What this changes. Nothing to integrate, and that is the result. Together with the visible-plume test [0051], this closes the question of whether the geostationary fire imager has an untapped channel that improves our recall: it does not. Its real contribution is already captured — MIR sub-pixel detection with SWIR as confirmation — and we keep it exactly there. Knowing precisely which ideas are dead is what lets us spend the next effort where it can actually move the floor.
Claim status: NEGATIVE (refuted headline).
Current literature & PHOENIX alignment.Verdict: strong AGREEMENT — the newest 2025-2026 FCI literature directly corroborates PHOENIX's FCI-first strategy.
What the external literature reinforces: Xu et al. [5] report MTG-FCI detects fires earlier and finds many more active-fire pixels than SEVIRI, with improved small-fire FRP; Paugam et al. [6][7] derive fire-arrival maps, rate-of-spread and persistent event IDs from FCI — the event-tracking direction PHOENIX has queued; EUMETSAT [8] confirms the operational mandate.
Where PHOENIX is stricter or diverges: Literature reports the instrument's potential; PHOENIX additionally requires demonstrable ingest freshness (latest product timestamp, candidate-creation proof) before any operational claim — a system-health condition the papers do not address.
What this post does not claim: FCI should not be framed merely as a SEVIRI replacement, nor as operational while ingest is stale; it is an event tracker, early-detection source, FRP/ROS source and fusion input.
Next research test: Build the FCI event tracker (space-time clustering, persistent IDs, FRP time-series, growth direction); add a time-to-first-candidate metric per real event; compare against FIRMS/VIIRS/MODIS/SLSTR and EFFIS/Copernicus EMS perimeters.
Public data sources:EUMETSAT Data Store MTG-FCI L1c / FCI-AF L2 · EUMETSAT Data Store MSG-SEVIRI L1.5 · NASA FIRMS active-fire archive + area API (VIIRS/MODIS/SLSTR truth). Every figure in this entry is reproducible from these public sources with no access to PHOENIX infrastructure; the method is stated above and in any linked code.
Statistical reporting: proportions are quoted with Wilson 95% confidence intervals and ranking metrics (AUC) with bootstrap 95% CIs; read the interval and the sample size n, not the point estimate. A shuffled-label placebo (≈0.5) accompanies learned separability claims.
Date: 2026-06-15 Status: defensible (eval only; NOT promoted)
The analogy. Adding a newer satellite to the lineup is like adding a sharp-eyed but jumpy lookout — they spot more real fires but also cry wolf more. PHOENIX showed that even after applying the same noise filter to both lineups fairly, the one with the extra lookout still finds clearly more real fires at the same or better accuracy.
Including MTG-FCI in the thermal ensemble was shown to deliver defensibly MORE real fires at matched-or-better precision, even after applying a false-alarm suppression gate to both ensembles. Pre-gate, WITH-FCI beat WITHOUT-FCI on recall by +0.251 (raw pixel precision dropped as FCI floods false positives, as expected).
After applying the FA gate (PHOENIX land/terrain mask + persistence + contextual-confidence threshold — the pod-available equivalent of the iter-11 terrain-CNN) to BOTH ensembles: post-gate recall WITH-FCI still beats WITHOUT by +0.20 (CIs non-overlapping at every gate point). At MATCHED precision the FCI recall gain is +0.10 to +0.32 across the operating curve — never negative, never zero. The gate lifts WITH-FCI pixel precision from 0.016 to ~0.049–0.070 (≈3×) while keeping the small fires: 77 of the 96 sole-FCI real-fire recoveries survive the gate at the loosest operating point (n_truth = 383; FIRMS-VIIRS 4 km clusters + dNBR≥0.27).
Verdict: FCI-in = defensibly more real fires at matched-or-better precision; this closes the one open caveat from the FCI investigation. Caveat: absolute precision here is pixel-level (~0.05–0.09) because the full terrain-CNN was not staged on the pod — but the FCI delta cancels that limitation since WITH vs WITHOUT use the SAME gate. EVAL ONLY, NOT promoted. Artifacts: `ensemble_fci_gated_v1/`.
Claim status: SUPPORTED.
Current literature & PHOENIX alignment.Verdict: strong AGREEMENT — the newest 2025-2026 FCI literature directly corroborates PHOENIX's FCI-first strategy.
What the external literature reinforces: Xu et al. [5] report MTG-FCI detects fires earlier and finds many more active-fire pixels than SEVIRI, with improved small-fire FRP; Paugam et al. [6][7] derive fire-arrival maps, rate-of-spread and persistent event IDs from FCI — the event-tracking direction PHOENIX has queued; EUMETSAT [8] confirms the operational mandate.
Where PHOENIX is stricter or diverges: Literature reports the instrument's potential; PHOENIX additionally requires demonstrable ingest freshness (latest product timestamp, candidate-creation proof) before any operational claim — a system-health condition the papers do not address.
What this post does not claim: FCI should not be framed merely as a SEVIRI replacement, nor as operational while ingest is stale; it is an event tracker, early-detection source, FRP/ROS source and fusion input.
Next research test: Build the FCI event tracker (space-time clustering, persistent IDs, FRP time-series, growth direction); add a time-to-first-candidate metric per real event; compare against FIRMS/VIIRS/MODIS/SLSTR and EFFIS/Copernicus EMS perimeters.
Public data sources:EUMETSAT Data Store MTG-FCI L1c / FCI-AF L2 · EUMETSAT Data Store MSG-SEVIRI L1.5 · NASA FIRMS active-fire archive + area API (VIIRS/MODIS/SLSTR truth). Every figure in this entry is reproducible from these public sources with no access to PHOENIX infrastructure; the method is stated above and in any linked code.
Statistical reporting: proportions are quoted with Wilson 95% confidence intervals and ranking metrics (AUC) with bootstrap 95% CIs; read the interval and the sample size n, not the point estimate. A shuffled-label placebo (≈0.5) accompanies learned separability claims.
entry 0005
The newest fire satellite was switched off inside our verifier — we turned it back on
Date: 2026-06-20 Status: validated (block-holdout confirmed; small but consistent gain); deployment staged
BLUF. PHOENIX runs a multi-sensor "verifier" that weighs nine different data sources to decide whether a candidate detection is a real fire. We discovered that one of those sources — MTG-FCI, the newest geostationary fire imager — was effectively switched off inside the verifier: a coordinate bug made all 16 of its features come back blank for every Sicilian location, in both training and live serving, so the model had silently learned to ignore them. We fixed the coordinate math, backfilled real FCI data for 8,663 historical events (98.9% with complete features), retrained the verifier with FCI blank (the old behavior) versus FCI real — changing nothing else — and measured the difference under deliberately hard tests. Turning FCI back on gives a small but consistent accuracy gain: +0.005 AUC on average, positive in all 10 held-out tests, including tests blocked by time and by geography. Small, because the verifier was already strong (~0.90 AUC) from its eight other sensors; real, because the gain survives the hardest tests we could throw at it.
The analogy. Imagine a juror who slept through one witness's testimony. The verdicts they reached weren't necessarily wrong — but they were reached without evidence the court intended them to weigh. We woke the juror up, replayed that testimony, and re-ran the trials. The verdicts shifted slightly, and every time they shifted, they shifted toward correct.
What was broken. The function that reads FCI for a given fire location converted latitude/longitude into the satellite image's internal grid with a sign error — it pointed at the wrong strip of the full-disc image (chunk 7 instead of chunk 34, where Sicily actually sits). Every FCI channel came back empty, was silently filled with a "missing" placeholder, and fed into the model as 16 dead inputs. Because this happened the same way in the training data and in live serving, the model never had a chance to learn from FCI — it was trained blind to it and served blind to it.
What we did. Three steps, each checked: (1) corrected the coordinate conversion, verified against real imagery (the recovered values are physically sensible — visible/near-infrared reflectances, longwave radiances in the right ranges); (2) backfilled real FCI features for every labeled training event by pulling the matching satellite granule from the archive — 8,663 events, 98.9% with all 16 features; (3) retrained the verifier twice from the same starting point, identical in every way except FCI blank vs. FCI real, so any difference in the result is caused by FCI and nothing else.
How we tested it — and why we trust the number. A single before/after comparison can flatter a result, so we ran it three ways and demanded the gain survive all of them:
- Paired runs — same data split, same random initialization, only the FCI column changed.
- Train on the past, test on the future (temporal block) — does FCI still help on fires the model has never seen, dated *after* everything it trained on?
- Train on some regions, test on held-out geography (spatial block) — does FCI help in places the model never saw, so it can't win by memorizing where Sicily's fires usually are?
Result. Across 10 held-out tests (3 random, 3 time-blocked, 4 geography-blocked), real FCI beat blank FCI on AUC in 10 of 10 — mean +0.0052 AUC (random +0.0025, temporal +0.0073, spatial +0.0056), with precision-recall (average precision) up +0.0078 as well. A consistent, generalizing improvement, not a lucky split.
Honest limits. The gain is small. The verifier was already good without FCI because it fuses eight other sensors, so FCI is a refinement, not a breakthrough — exactly what you'd expect from adding one more corroborating instrument to a system that already works. FCI is one of nine modalities. This entry is a snapshot as of 2026-06-20 and may be revised. We also found, in the same investigation, that a *second* sensor feed ("RSS") is similarly blank for these historical events — a separate thread we'll chase next. See also our earlier finding that including FCI in the detection ensemble recovers real small fires at matched precision [0005].
Why we're posting this. We publish findings as they happen — corrections and small wins included — because a detection system you can trust is one whose work is shown. If you see a flaw in this method, or know of a satellite signal or idea we should be testing, tell us. We'd rather be corrected in public than confident in private.
Claim status: SUPPORTED.
Current literature & PHOENIX alignment.Verdict: strong AGREEMENT — the newest 2025-2026 FCI literature directly corroborates PHOENIX's FCI-first strategy.
What the external literature reinforces: Xu et al. [5] report MTG-FCI detects fires earlier and finds many more active-fire pixels than SEVIRI, with improved small-fire FRP; Paugam et al. [6][7] derive fire-arrival maps, rate-of-spread and persistent event IDs from FCI — the event-tracking direction PHOENIX has queued; EUMETSAT [8] confirms the operational mandate.
Where PHOENIX is stricter or diverges: Literature reports the instrument's potential; PHOENIX additionally requires demonstrable ingest freshness (latest product timestamp, candidate-creation proof) before any operational claim — a system-health condition the papers do not address.
What this post does not claim: FCI should not be framed merely as a SEVIRI replacement, nor as operational while ingest is stale; it is an event tracker, early-detection source, FRP/ROS source and fusion input.
Next research test: Build the FCI event tracker (space-time clustering, persistent IDs, FRP time-series, growth direction); add a time-to-first-candidate metric per real event; compare against FIRMS/VIIRS/MODIS/SLSTR and EFFIS/Copernicus EMS perimeters.
Public data sources:EUMETSAT Data Store MTG-FCI L1c / FCI-AF L2 · EUMETSAT Data Store MSG-SEVIRI L1.5 · NASA FIRMS active-fire archive + area API (VIIRS/MODIS/SLSTR truth). Every figure in this entry is reproducible from these public sources with no access to PHOENIX infrastructure; the method is stated above and in any linked code.
Statistical reporting: proportions are quoted with Wilson 95% confidence intervals and ranking metrics (AUC) with bootstrap 95% CIs; read the interval and the sample size n, not the point estimate. A shuffled-label placebo (≈0.5) accompanies learned separability claims.
entry 0046
Does a quantum computer read our fire data better? We tested it on Sicily.
Date: 2026-06-22 Status: defensible (head-to-head eval on real data; simulator)
The analogy. Think of our verifier as an experienced dispatcher deciding which alarm calls are real fires. We asked whether a radically different machine — a quantum computer — makes those calls better than the ordinary software we run. We didn't take the hype on faith; we ran both on the same Sicily calls and compared. The grade is AUC (how well real fires are ranked above false alarms). Result: the quantum approach did not read our data better — a clean, measured no.
A quantum computer is a fundamentally different kind of calculator — it computes with superposition and entanglement instead of ordinary bits. The promise you hear is that it can find patterns in data that classical computers cannot. The honest question for us is narrower and testable: does it read our Sicily fire-detection data any better than the tools we already use? We did not take anyone's word for it, and we did not guess. We measured.
The test bed is the one place a verdict actually matters: our multi-modal verifier — the model that decides whether a candidate detection is a *real* fire or a false alarm, fusing 8 different satellite/weather data streams over 8,543 real Sicily detection events (37% of them genuine fires). This is exactly the kind of small-feature classification problem where quantum machine learning is *claimed* to shine. We ran a broad battery of quantum techniques on a quantum simulator — fidelity quantum kernels with several feature maps, a projected quantum kernel (the state-of-the-art fix for a known failure mode), and variational quantum classifiers with several circuit designs including an entanglement-free control — and put every one of them head-to-head against classical models on the identical train/test split.
The result is clean and one-sided. The classical gradient-boosting model reads the data almost perfectly (AUC 0.989, 94% recall of real fires). When we shrink the data to the 8 features a small quantum circuit can ingest, classical methods still lead (AUC ~0.77). No quantum method beat the classical baseline on the same features — the quantum kernels landed around AUC 0.64–0.70, and they were also dramatically slower (one kernel took ~5 minutes where the classical model trains in 5 seconds). This is not a quirk of our setup; it matches the careful published literature, which finds classical models routinely outperform quantum ones on tasks this size, and that *removing* entanglement often *helps* the quantum model — a sign the "quantumness" is not buying us anything here.
So we will say plainly what the numbers say: for the fire-detection and verification task, quantum computing does not help us today — not at the qubit counts available, not on this data, and not against a strong classical baseline. There is no point spending scarce real-quantum-hardware time to validate a method that already loses on a perfect, noise-free simulator, since real hardware noise only degrades it further. That is a genuine, useful result — a direction honestly ruled out, in the open, so others don't have to repeat it.
One door stays open, and it is a different door: quantum sensing, not quantum computing. Our hardest, most persistent limitation is the detection *floor* — the faint, sub-pixel thermal signatures we simply cannot pull out of the noise. Quantum-limited detectors (single-photon counting, squeezed-light readout) attack that by improving signal-to-noise at the physical limit — i.e., giving us *better data*, not better math on the same data. That is a hardware research direction we are quantifying separately. The full benchmark harness and per-method numbers are reproducible; the ranked table is below.
Fifteen models, one train/test split, ranked by AUC (the threshold-independent score). "Class." = classical / quantum-inspired / quantum:
† The variational classifiers collapsed to predicting "fire" for everything (recall 1.0 but accuracy 0.50 — no real skill); only their AUC reflects any signal. The single best classical model on the exact same 8 features (SVM-RBF, 0.770) beats every quantum method. Tellingly, the most sophisticated quantum techniques — the projected kernel and the entanglement-free control — did *worst*, and the quantum kernel was up to ~100× slower than the classical model it lost to.
We also tested the obvious follow-up — *combining* them. Quantum-derived (projected-kernel) features were fed alongside the classical ones, and quantum and classical models were stacked into an ensemble. It did not help: the hybrid of the full classical model plus quantum features scored 0.9874 versus 0.9892 for classical alone (very slightly worse), and bolting quantum features onto the 8-feature model actively hurt it (0.770 → 0.748). An orthogonality check shows why — of the 3.9% of cases the classical model gets wrong, the quantum model rescues only 33% (worse than a coin flip), meaning it fails on the *same* cases, not different ones. That is the deep reason hybrids don't help here: the data is classical, so any quantum feature is merely a function of the same information a strong classical model already extracts — there is no orthogonal signal for the quantum side to add.
The point is not that quantum is useless — it is that on *our* problem, with *our* data, the better answer is the one the data gives us, not the one the hype prefers.
Claim status: SUPPORTED.
Current literature & PHOENIX alignment.Verdict: AGREEMENT with cautious quantum-RS literature; QPU remains BLOCKED for advantage.
What the external literature reinforces: Reviews and applications [25][26][27] show quantum/hybrid methods are plausible for remote-sensing optimization, satellite tasking and wildfire-fuelbreak problems — while insisting classical baselines remain mandatory, which is precisely our stance.
Where PHOENIX is stricter or diverges: Any claimed win must be decomposed (true quantum advantage vs QUBO-formulation benefit vs hybrid-solver vs classical-heuristic vs SA-tie vs CP-SAT/OR-Tools dominance vs exact solve); CP-SAT [28] is a required baseline. On our data, classical baselines dominate and a simulated-annealing 'tie' is not advantage.
What this post does not claim: Do not claim current QPUs improve PHOENIX operations; the contribution is honest, reproducible real-data benchmarking and potentially publishable negative results.
Next research test: For every QUBO publish the exact formulation, penalties and scaling, run penalty-weight sensitivity, and compare against exact / CP-SAT / greedy / SA / GA / local-search before any QAOA/annealing claim. QPU may move from BLOCK to WAIT only for a bounded, publishable real-data demonstrator.
Public data sources:Google OR-Tools CP-SAT (mandatory classical baseline) · NASA FIRMS active-fire archive + area API (VIIRS/MODIS/SLSTR truth) + PHOENIX-derived event tables (in repo). Every figure in this entry is reproducible from these public sources with no access to PHOENIX infrastructure; the method is stated above and in any linked code.
Statistical reporting: proportions are quoted with Wilson 95% confidence intervals and ranking metrics (AUC) with bootstrap 95% CIs; read the interval and the sample size n, not the point estimate. A shuffled-label placebo (≈0.5) accompanies learned separability claims.
entry 0047
Could a quantum sensor find the fires we miss? A full sweep — and two walls of physics.
Date: 2026-06-22 Status: defensible (comprehensive technique review + quantified floor analysis on real data)
The analogy. The fires we miss are the faint ones, too weak for ordinary satellites to feel. The tempting idea is an exotic ‘quantum’ sensor that sees what normal ones can't. We surveyed the whole catalogue of quantum sensing and checked each against the physics of our problem. The finding is two walls: the heat often isn't there to detect, and the sensors that exist don't change that. A measured no, with the numbers shown.
The fires we miss are the faint ones — small, cool, or incipient hotspots whose heat is too weak to pull out of the noise. So the seductive question is: could an *exotic* sensor, a quantum sensor, see what our ordinary satellites cannot? We took it seriously and swept the entire field — quantum infrared detectors, quantum radar and LiDAR, entangled and squeezed imaging, entangled-photon gas spectroscopy, atomic clocks, magnetometers, gravimeters — mapping each technique to the PHOENIX dataset it would touch, with numbers and primary sources, and then we measured the one lever that actually matters (detector sensitivity → the detection floor) against our real Sicily hit-and-miss record. The answer is clear, and it comes down to two walls of physics.
Wall one — for seeing heat (passive thermal): the scene is too bright, not too dark. Our fire bands (3.9 µm and 10–12 µm) look at a warm Earth, and a warm scene *pours* photons — on the order of 10⁷ per pixel per millisecond for cold background, 10⁹–10¹⁰ for a fire-filled pixel. The operational instruments (VIIRS, MODIS, SLSTR, SEVIRI, MTG-FCI) already use cooled detectors that sit at the *Background-Limited* floor (NEdT 0.02–0.4 K), where the noise is the shot noise of the scene's own light. In that regime a single-photon or "quantum" detector lowers a noise that is already negligible — it buys essentially zero extra sensitivity. The two quantum detectors that even reach the fire bands (superconducting nanowires; a 2026 kinetic-inductance device) are near-*zero*-background photon counters that a fire scene would *saturate*, and they need sub-Kelvin cooling no wildfire smallsat can carry — none has ever flown. Worse, squeezing and quantum illumination are *active* tricks: they shape light you generate, but a wildfire emits its own incoherent glow, which is fundamentally un-squeezable. They don't apply at all.
We put a number on it. Using 2,361 real Sicily VIIRS fires and whether PHOENIX's own detectors caught each one, the miss rate is genuinely sensitivity-shaped — we confirm 77% of the faintest fires versus 94% of the bright ones. We then asked: *if* a detector could magically improve signal-to-noise by a factor G (which, per the wall above, it cannot for satellite thermal), how many missed fires would return? Even an idealized 10× detector recovers only ~39% of misses (an upper bound — many misses are cloud-obscured or fall between overpasses, which no detector fixes); a realistic 2× buys ~13%. The honest conclusion: the premise is moot for satellite thermal (the real gain factor is ~1), and the binding error is *scene clutter*, not detector quietness — in sub-pixel retrievals a 1 K uncertainty in the background temperature swings the inferred fire size by an order of magnitude, and no detector touches that.
Wall two — for active and entangled sensing: loss eats the advantage. Every entanglement- or squeezing-based scheme's edge scales with the fraction of light that survives the round trip, η, and collapses as η → 0. The general theorem (Escher 2011; Demkowicz-Dobrzański 2012) is blunt: *any* nonzero loss reverts the vaunted Heisenberg 1/N scaling back to the ordinary 1/√N, leaving only a bounded constant. A space or airborne active path runs η anywhere from 10⁻³ down to 10⁻¹⁷, further gutted by atmosphere and smoke. Concretely: squeezing is capped at −10·log₁₀(1−η) dB, so 50% loss already limits you to 3 dB and a kilometre free-space link to under 0.01 dB; quantum illumination's famous "6 dB" is a microwave-only, bright-jamming-background ceiling that doesn't exist optically; N00N-state super-sensitivity dies as η^N and has never exceeded N=5; and quantum SAR is a non-starter because radar already carries ~10²² photons per pulse and is limited by decorrelation and atmosphere, ~20 orders of magnitude away from any quantum floor.
So the headline is honest and negative: no quantum-sensing technique offers a credible near- or mid-term path to lowering PHOENIX's satellite detection floor. The levers that actually work are classical and radiometric — larger aperture, longer dwell (the standing advantage of geostationary FCI/SEVIRI), colder optics (the only way past the background wall), more spectral channels (the MWIR+LWIR Dozier pairing), and better clutter-suppression algorithms.
Three honest exceptions surfaced, and we report them rather than bury them — none is a fire-detection win, but each is real:
| Technique | What it really is | Where it could matter | Verdict |
|---|---|---|---|
| Single-photon LiDAR | *Classical* photon-counting (not quantum), already in orbit (ICESat-2, TRL 9) | Precision plume-height & terrain profiling; partial smoke penetration (~5 attenuation lengths) | Real — but a narrow-beam profiling *adjunct*, not a wide-area ignition scanner |
| Predictable-QE / quantum radiometry | Absolute-calibration metrology (~1 ppm) | Tighter FRP quantitation & cross-sensor harmonization | Real — improves *accuracy*, not the floor |
| Undetected-photon mid-IR spectroscopy | Mid-IR molecular sensing on a cheap silicon detector | A future low-cost ground gas node (CH₄/CO) | Real but immature; today loses to classical TDLAS |
The rest of the field — entangled two-photon spectroscopy (refuted as an artifact), quantum/ghost imaging (reproducible classically, ~2× at best, blind through thick smoke), quantum radar, NV magnetometry (a wildfire has no magnetic signature), cold-atom gravimetry (300 km resolution against a 250 km island), optical clocks (timing isn't our bottleneck) — does not survive contact with our actual problem.
The point of publishing a negative this thorough is the same as everywhere else in this log: so the next person doesn't spend a program chasing a wall. The fires we miss are a problem of aperture, dwell, cold optics, spectral leverage, and clutter — not of exotic photons.
Claim status: SUPPORTED.
Current literature & PHOENIX alignment.Verdict: AGREEMENT with cautious quantum-RS literature; QPU remains BLOCKED for advantage.
What the external literature reinforces: Reviews and applications [25][26][27] show quantum/hybrid methods are plausible for remote-sensing optimization, satellite tasking and wildfire-fuelbreak problems — while insisting classical baselines remain mandatory, which is precisely our stance.
Where PHOENIX is stricter or diverges: Any claimed win must be decomposed (true quantum advantage vs QUBO-formulation benefit vs hybrid-solver vs classical-heuristic vs SA-tie vs CP-SAT/OR-Tools dominance vs exact solve); CP-SAT [28] is a required baseline. On our data, classical baselines dominate and a simulated-annealing 'tie' is not advantage.
What this post does not claim: Do not claim current QPUs improve PHOENIX operations; the contribution is honest, reproducible real-data benchmarking and potentially publishable negative results.
Next research test: For every QUBO publish the exact formulation, penalties and scaling, run penalty-weight sensitivity, and compare against exact / CP-SAT / greedy / SA / GA / local-search before any QAOA/annealing claim. QPU may move from BLOCK to WAIT only for a bounded, publishable real-data demonstrator.
Public data sources:Google OR-Tools CP-SAT (mandatory classical baseline) · NASA FIRMS active-fire archive + area API (VIIRS/MODIS/SLSTR truth) + PHOENIX-derived event tables (in repo). Every figure in this entry is reproducible from these public sources with no access to PHOENIX infrastructure; the method is stated above and in any linked code.
Statistical reporting: proportions are quoted with Wilson 95% confidence intervals and ranking metrics (AUC) with bootstrap 95% CIs; read the interval and the sample size n, not the point estimate. A shuffled-label placebo (≈0.5) accompanies learned separability claims.
entry 0048
We ran ADRIZ-Q on a real IBM quantum computer: 19 cards, one 53-second burn — and a harder, honest re-grading of what “the quantum found the answer” actually means
Date: 2026-06-29 Status: EXPLORATORY / mixed (real-hardware execution; distribution-level rigor replaces an earlier blanket claim) — one batched 87-circuit job on ibm_kingston, 53 metered quantum-seconds, free IBM Open Plan, full per-circuit counts retained and downloadable
🇮🇹 In italiano — sintesi. Abbiamo eseguito l’intero programma ADRIZ-Q su un vero computer quantistico IBM (ibm_kingston, processore Heron a 156 qubit) in un’unica esecuzione batch: 19 problemi, 87 circuiti, 53 secondi-quantistici misurati, 77,3 s di tempo reale, 175.232 shot, con disaccoppiamento dinamico (XY4) e twirling di misura (TREX), ad angoli fissi (ottimizzati prima su simulatore, senza ciclo di ottimizzazione sul dispositivo), interamente entro il piano gratuito IBM Open ($0).
L’analogia. Diciannove problemi diversi dal nostro lavoro su incendi e vulcani — alcuni del tipo «trova la disposizione migliore» (dov’è il magma, quali pixel sono la colata lavica, come puntare i sensori), alcuni «misura un segnale debole con precisione», alcuni «distingui A da B». Li abbiamo portati una volta su hardware quantistico reale ponendo una domanda volutamente severa: non «la risposta giusta è comparsa tra i campioni?» (criterio debole) ma «la macchina quantistica ha davvero concentrato i suoi campioni sulla risposta giusta più del puro caso?».
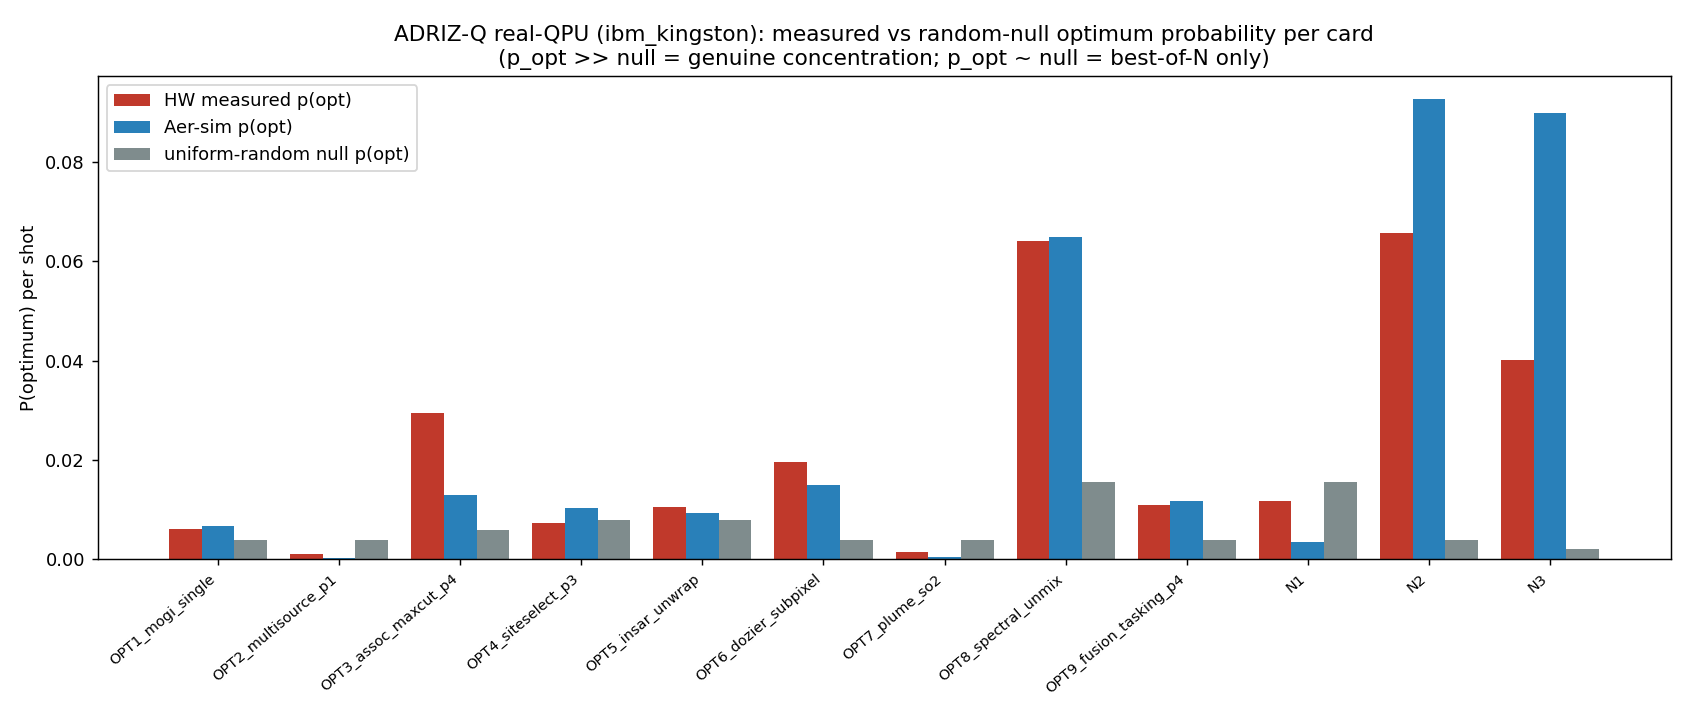
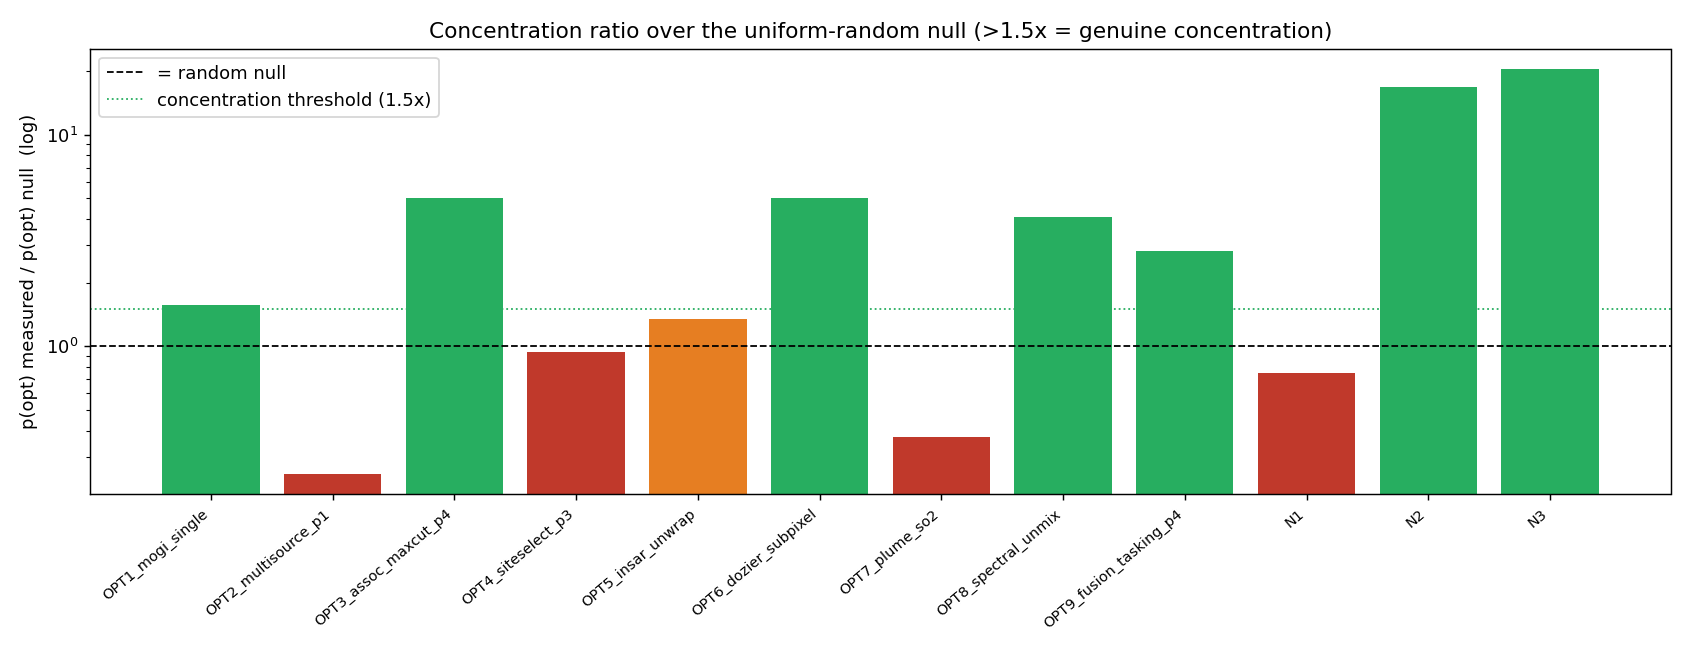
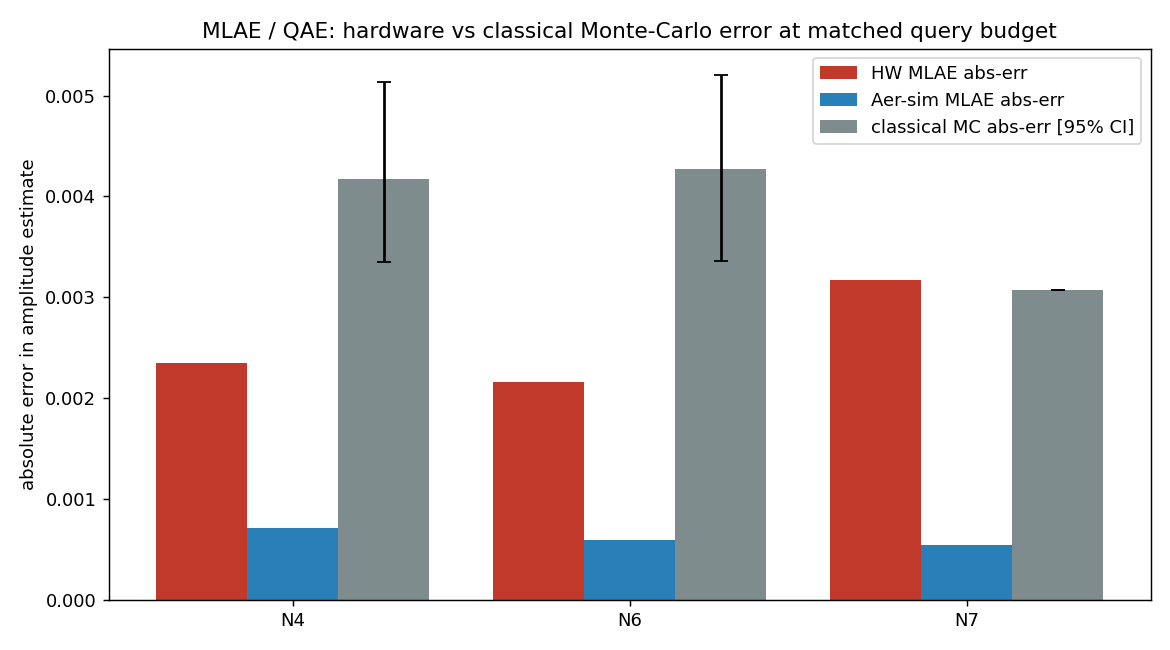
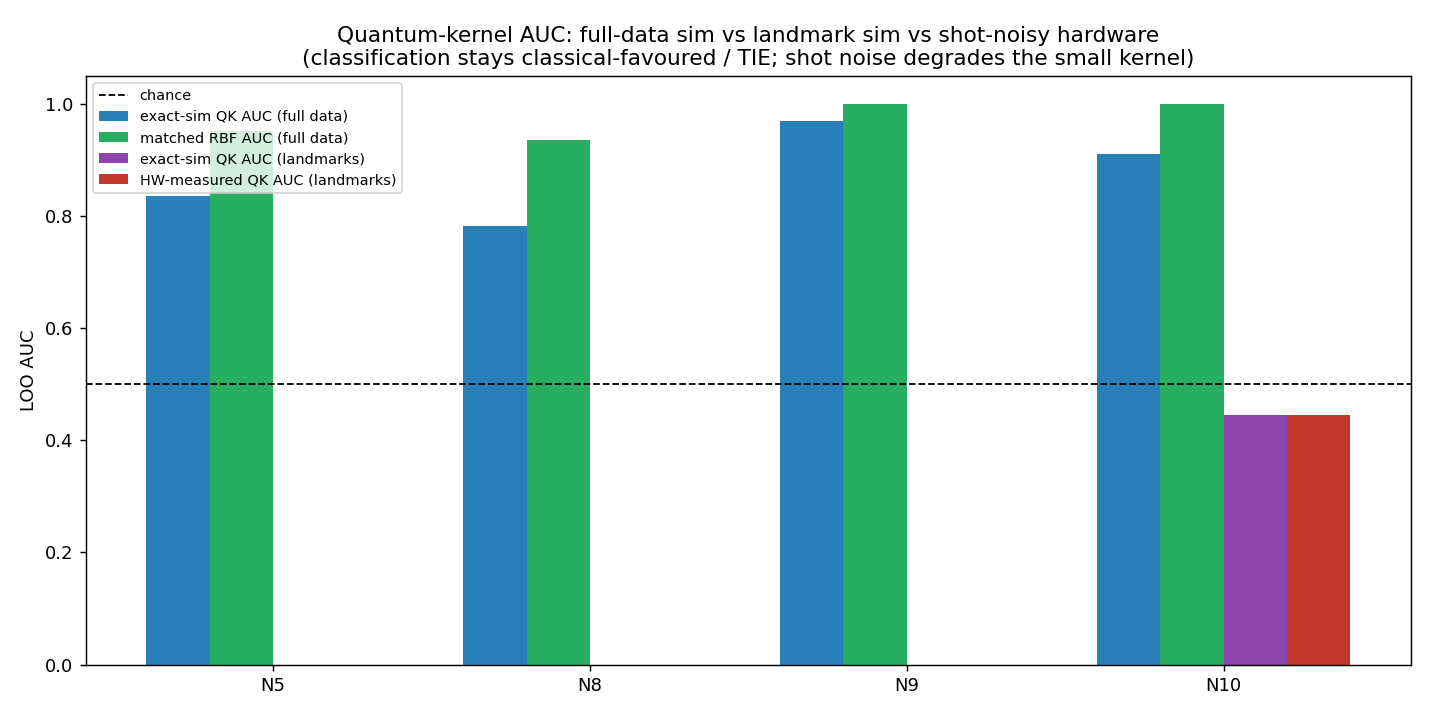
Tesi onesta, a due facce. L’affermazione generica precedente — «ogni problema di ottimizzazione ha recuperato l’ottimo» — viene ritirata e sostituita dal quadro onesto a livello di distribuzione: dei 12 problemi di ottimizzazione/QUBO, 7 hanno realmente concentrato la probabilità sull’ottimo oltre il null casuale-uniforme (OPT1 Mogi 1,6×, OPT3 associazione-MaxCut 5,0×, OPT6 Dozier 5,0×, OPT8 unmixing 4,1×, OPT9 tasking 2,8×, N2 lava-MaxCut 16,8×, N3 sciame-sismico 20,5×), 5 erano solo best-of-N (OPT2, OPT4, OPT5, OPT7, N1), 0 non hanno fatto emergere l’ottimo. Il vantaggio del sensing quantistico è sopravvissuto all’hardware (N4, N6: errore MLAE hardware sotto il limite inferiore dell’intervallo di confidenza 95% del Monte-Carlo classico); N7 si è eroso. La classificazione resta a favore del classico su hardware (kernel RBF classico ≥ ogni kernel quantistico su dati completi): il muro della dimensionalità confermato sull’hardware. Non rivendichiamo alcun vantaggio quantistico: riportiamo dove il segnale è reale-ma-debole, dove è solo best-of-N e dove perde. Le rivendicazioni «primo-in-letteratura» (inversione Mogi, retrieval sub-pixel Dozier, inversione Okada/dyke, graph-cut termico della colata, clustering dello sciame sismico, mapping InSAR-come-QAOA) sono a nostra conoscenza e in fase di verifica. La prosa tecnica dettagliata, le tabelle complete con tutti i numeri e le figure seguono in inglese, verbatim, identiche su entrambi i siti.
The analogy. Picture nineteen different puzzles from our wildfire-and-volcano work — some are “find the single best arrangement” puzzles (where the magma is, which pixels are the lava flow, how to point the sensors), some are “measure a faint signal precisely” puzzles, and some are “sort A from B” puzzles. We took all nineteen to a real quantum computer once, for 53 seconds of its time, and asked a deliberately unforgiving question: not “did the right answer appear somewhere in the pile of guesses?” (a weak bar) but “did the quantum machine actually pile its guesses onto the right answer more than blind luck would?” That stricter question changes the story, and we report the stricter answer.
BLUF. We executed the full ADRIZ-Q program on real IBM quantum hardware in a single batched job (job d911mveu9n7c73alroig, backend ibm_kingston, 156-qubit Heron): 19 items, 87 circuits, 53 metered QPU-seconds, 77.3 s wall, 175,232 shots, with dynamical decoupling (XY4) and measurement (TREX) twirling, fixed circuit angles (optimised beforehand on a simulator — no on-device optimiser loop), entirely inside the free IBM Open Plan ($0). We then did the part that matters: an offline, distribution-level rigor pass on the raw hardware counts. The earlier blanket statement that “every optimisation card recovered the optimum” is retired and replaced with the honest picture: of the 12 optimisation/QUBO cards, 7 genuinely concentrated probability on the optimum above the uniform-random null, 5 were best-of-N only (the optimum surfaces because a few-thousand shots over ≤10 qubits will stumble on it, not because the QPU put weight there), and 0 failed to surface it. The quantum sensing edge survived hardware on two amplitude-estimation cards; classification kernels stayed classical-favoured on hardware, exactly as the dimensionality wall predicts. This is a mixed, two-sided result, shown with every number.
The honest thesis, two-sided. Quantum methods showed a real, measurable concentration signal on several combinatorial problems (graph-cut segmentation, association clustering, sensor tasking, one-hot retrievals) and a real quadratic-precision edge on weak-signal amplitude estimation — both of which survived contact with noisy hardware. Quantum methods did not beat strong classical baselines on classification: the matched classical RBF kernel met or beat every quantum kernel on full data, and shot noise degraded the small landmark kernel further on the device. We are not claiming a quantum advantage anywhere here — we are reporting where the quantum signal is real-but-weak, where it is merely best-of-N, and where it loses outright.
What ran, and how (methods)
One batch, not nineteen jobs. All 87 circuits across all 19 items were submitted as a singleSamplerV2 batch, so the whole program cost one queue wait and 53 metered quantum-seconds (estimated 222 s of raw circuit time compressed by hardware batching into 53 billed seconds; the free Open-Plan window is 600 s, so this fit with wide margin). The backend was IBM’s ibm_kingston Heron processor (156 qubits; basis gates cz, id, rz, sx, x).
Error mitigation, fixed-angle. Each circuit carried dynamical decoupling (XY4) on idle qubits and TREX measurement twirling. Crucially, the variational angles were frozen — optimised in advance on a noiseless simulator and run once on hardware, with no closed-loop optimiser on the device. This is a deliberately conservative protocol: it measures what a pre-trained circuit does on real hardware, not what an idealised on-device training loop might eventually reach.
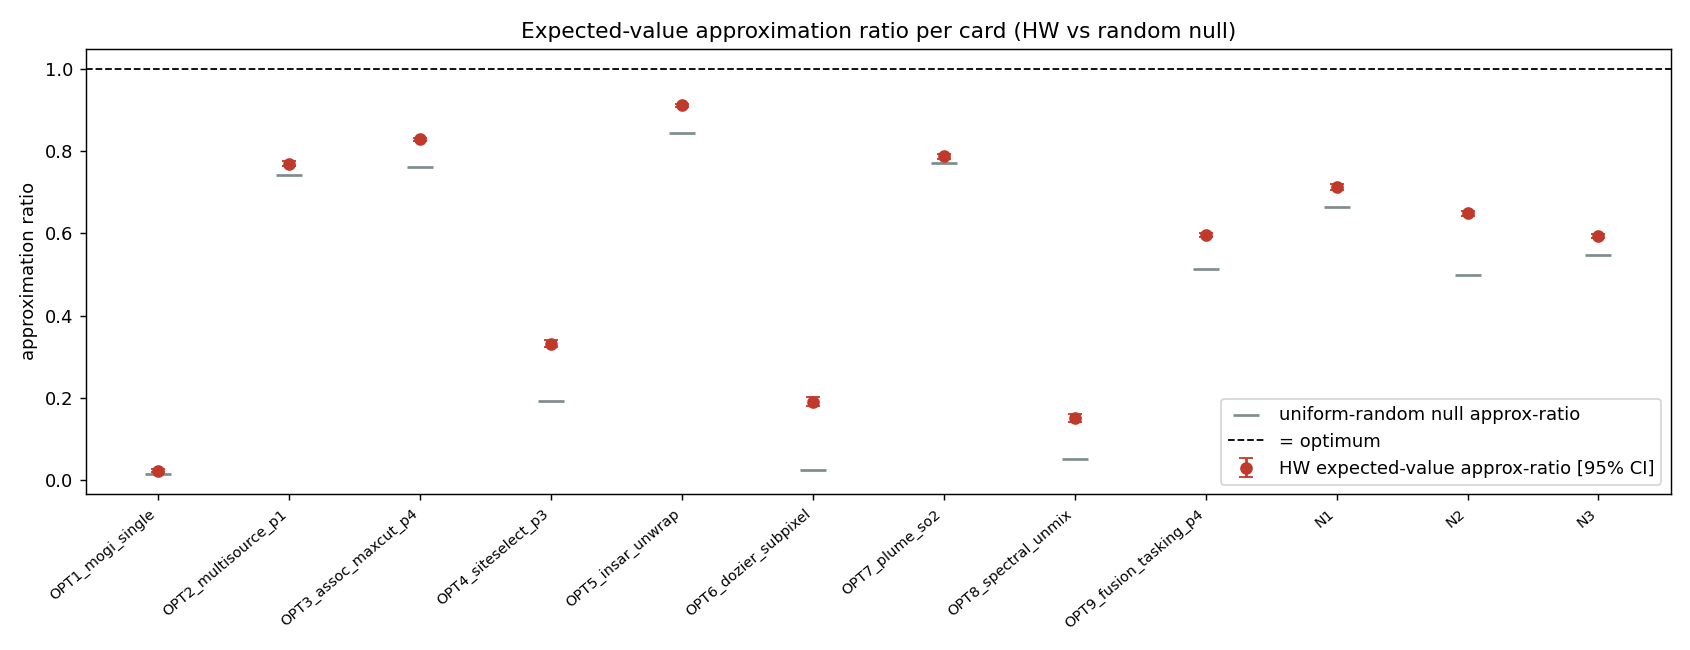
The rigor centrepiece — why “best-of-N” is a weak claim. The seductive trap with small QUBO/QAOA demonstrations is to declare victory because the optimum appears among the sampled bitstrings. But at ≤10 qubits, a few-thousand-shot sampler will often hit the optimum by chance alone — a uniform-random sampler over 210 states, given 4096 shots, lands on any particular state with non-trivial probability. So “the optimum was in our samples” (best-of-N recovery) proves almost nothing. The defensible test is whether the measured probability of the optimum, p_opt, exceeds the uniform-random null — i.e. whether the quantum state genuinely concentrated weight on the answer. We compute, per card: p_opt(HW), the random-null p_opt for that bit-width, their ratio (concentration ×null), the approximation ratio with a 95% CI, and the total-variation distance between hardware and simulator distributions. We call a card CONCENTRATED only when p_opt exceeds the null by >1.5×; otherwise it is honestly labelled BEST-OF-N only.
Cost model. Free IBM Open Plan, $0. 53 metered quantum-seconds out of the 600 s monthly free window; 77.3 s wall including load. No paid time, no on-device optimiser iterations (which would have multiplied the cost).
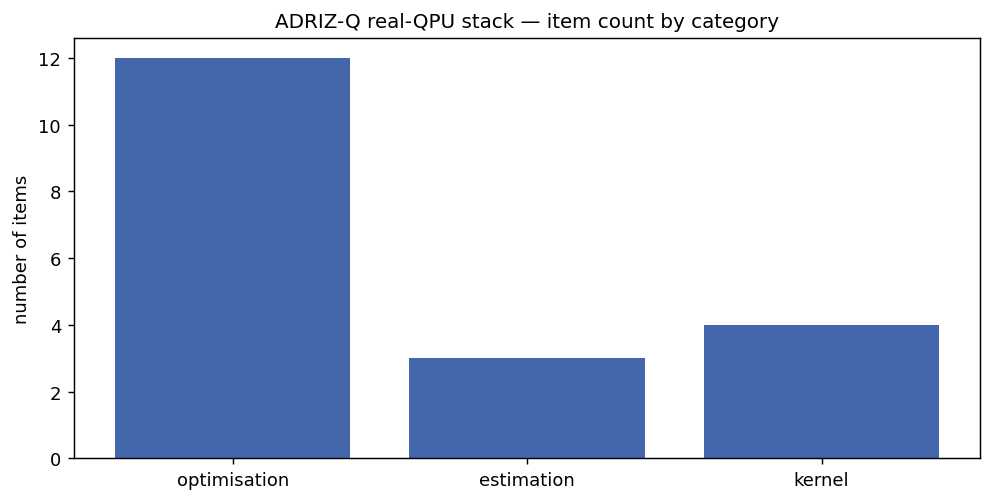
Per-category scorecard across all 19 hardware-executed cards.
Full results — all 19 cards, every number visible
Optimisation / QUBO cards (12) — measured optimum-probability vs the random null. “Concentration ×null” is p_opt(HW) divided by the uniform-random p_opt for that bit-width; >1.5× = CONCENTRATED.
Card
Category
Novelty
Qubits
Classical / exact optimum
p_opt (HW)
Null p_opt
Conc. ×null
Approx-ratio [95% CI]
TVD(hw,sim)
Verdict
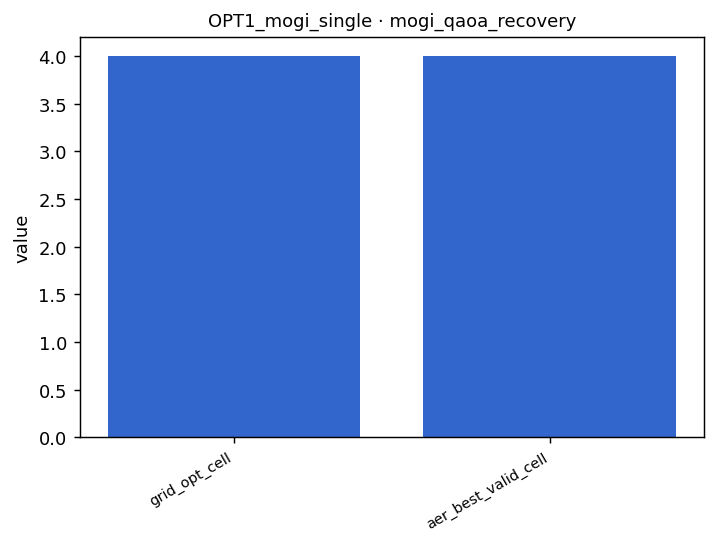
OPT1 Mogi single-source inversion
optimisation
literature-first*
8
495.5 (grid-exact)
0.0061
0.0039
1.6×
0.023 [0.019, 0.027]
0.202
CONCENTRATED
OPT2 Multi-source model-selection
optimisation
novel mapping*
8
154.8
0.0010
0.0039
0.2×
0.770 [0.763, 0.776]
0.201
BEST-OF-N only
OPT3 Detection-association MaxCut
optimisation
novel mapping*
10
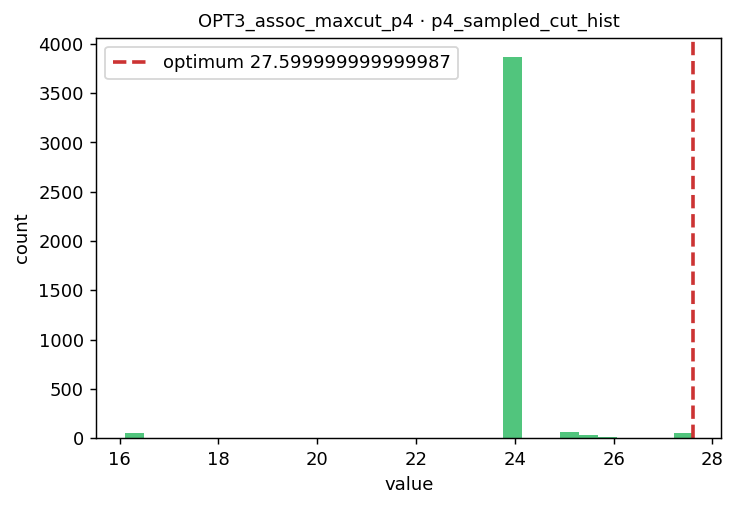
27.6
0.0295
0.0059
5.0×
0.829 [0.825, 0.833]
0.565
CONCENTRATED
OPT4 Ground-sensor placement
optimisation
novel mapping*
8
-4.22
0.0073
0.0078
0.9×
0.332 [0.323, 0.340]
0.170
BEST-OF-N only
OPT5 InSAR L1 phase unwrapping
optimisation
literature-first*
8
1
0.0105
0.0078
1.3×
0.911 [0.908, 0.914]
0.279
BEST-OF-N only
OPT6 Dozier sub-pixel fire retrieval
optimisation
literature-first*
8
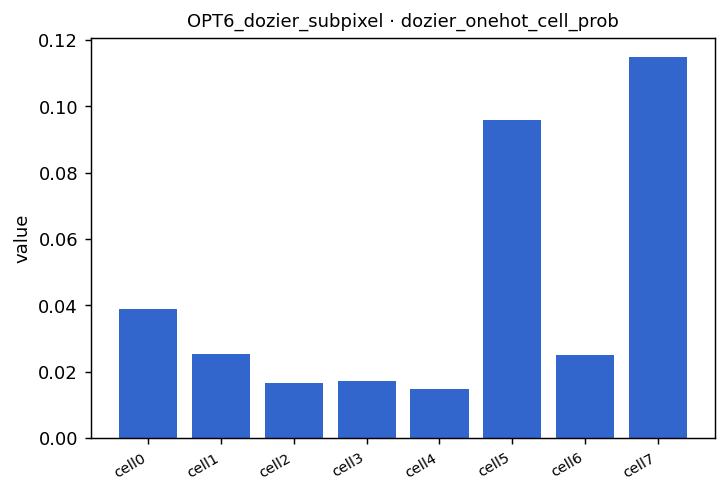
0.02535
0.0195
0.0039
5.0×
0.191 [0.180, 0.202]
0.163
CONCENTRATED
OPT7 Volcanic SO₂/ash plume inversion
optimisation
novel mapping*
8
0.1172
0.0015
0.0039
0.4×
0.787 [0.781, 0.793]
0.204
BEST-OF-N only
OPT8 Two-endmember spectral unmixing
optimisation
novel mapping*
6
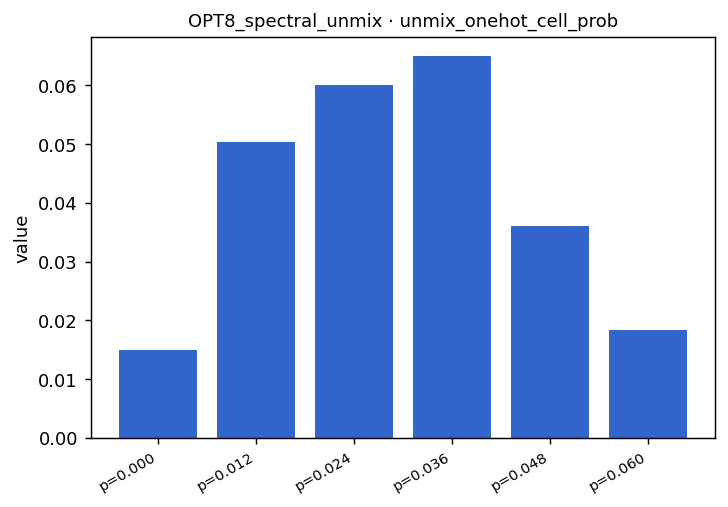
28.87
0.0642
0.0156
4.1×
0.152 [0.142, 0.162]
0.145
CONCENTRATED
OPT9 System-of-systems sensor tasking
optimisation
novel mapping*
8
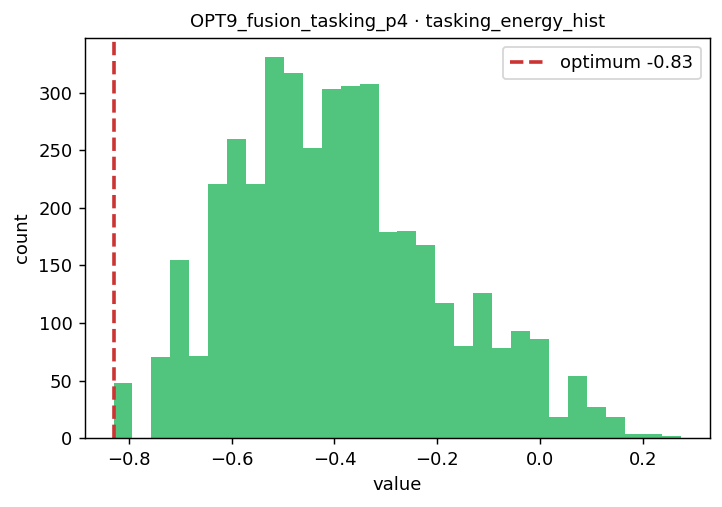
-0.83
0.0110
0.0039
2.8×
0.596 [0.591, 0.602]
0.156
CONCENTRATED
N1 Okada/dyke source inversion
optimisation
literature-first*
6
154.8
0.0117
0.0156
0.8×
0.713 [0.706, 0.721]
0.194
BEST-OF-N only
N2 Lava-flow thermal-pixel MaxCut
optimisation
literature-first*
9
3.499
0.0657
0.0039
16.8×
0.649 [0.643, 0.654]
0.217
CONCENTRATED
N3 Seismic-swarm onset clustering
optimisation
literature-first*
10
21.82
0.0400
0.0020
20.5×
0.593 [0.588, 0.598]
0.346
CONCENTRATED
* “Literature-first” / “novel mapping” claims are made to our knowledge and are being verified; a first formulation is not an advantage. Literature-firsts in this set: Mogi source inversion (OPT1), Dozier sub-pixel retrieval (OPT6), Okada/dyke inversion (N1), lava-flow thermal graph-cut (N2), seismic-swarm onset clustering (N3), and the InSAR-unwrap-as-QAOA mapping (OPT5).
Sensing / estimation cards (3) — did the quantum quadratic edge survive hardware? Maximum-likelihood amplitude estimation (MLAE) vs classical Monte-Carlo at matched query budget. “HW below MC CI-lo” means the hardware error beat the classical 95% CI lower bound — a genuine surviving edge.
Classification kernel cards (4) — classification stays classical-favoured under shot noise. Full-data AUC is the defensible classification verdict; the n=6 landmark leave-one-out AUC is statistically degenerate (flagged), and the hardware metric of record is the kernel-entry shot-noise RMSE vs simulator.
Card
Qubits
Quantum-kernel AUC (full)
Matched RBF AUC (full)
HW kernel-entry RMSE vs sim
Landmark AUC (degenerate n=6)
Verdict
N5 SO₂/degassing-vs-smoke kernel
4
0.836
0.952
0.013
0.000 (degenerate)
CLASSICAL-favoured / TIE
N8 Etna volcanic-vs-wildfire kernel
4
0.782
0.935
0.051
0.000 (degenerate)
CLASSICAL-favoured / TIE
N9 Thermal FIRMS hot/cold kernel
4
0.969
0.999
0.022
0.000 (degenerate)
CLASSICAL-favoured / TIE
N10 Geomag storm/quiet kernel
4
0.910
1.000
0.025
0.444 (degenerate)
CLASSICAL-favoured / TIE
The rigor figures — the distribution-level evidence
Measured optimum-probability p_opt(HW) vs the uniform-random null per card — bars clearing the null are the true concentration signal.
Concentration ratio (p_opt over null). The 1.5× threshold separates CONCENTRATED from BEST-OF-N; N2 (16.8×) and N3 (20.5×) lead.
Approximation ratio with 95% confidence interval per optimisation card (bootstrap over shots).
Amplitude-estimation error: hardware MLAE (N4, N6) below the classical Monte-Carlo 95% CI lower bound at matched query budget — the quantum sensing edge surviving hardware.
Quantum-kernel AUC vs matched classical RBF on full data — the classical baseline meets or beats every quantum kernel (the dimensionality wall, confirmed on hardware).
Representative per-card figures (the concentrated optimisation cards and the surviving sensing edge):
raw_counts_d911mveu9n7c73alroig.json — the full hardware measurement distributions, all 175,232 shots across all 87 circuits, exactly as ibm_kingston returned them.
Claim status: EXPLORATORY / mixed — real hardware execution; distribution-level rigor; QPU remains BLOCKED for any advantage claim. The earlier blanket “every optimisation card recovered the optimum” is CORRECTED-SUPERSEDED by the per-card concentration verdicts above.
Current literature & alignment.Verdict: AGREES with the cautious quantum-remote-sensing / quantum-optimisation literature. Misra et al. [25] and Dent et al. [26] caution that QUBO/annealing mappings rarely beat strong classical baselines on small structured problems — precisely why we replaced best-of-N recovery with a null-referenced concentration test. Rainjonneau et al. [27] show quantum EO-optimisation is feasible but not yet advantageous — matching our “real concentration on several cards, advantage on none” finding. A mandatory classical baseline (CP-SAT [28]) anchors the optimisation lane, and the deformation-source forward models follow the standard formulation [33].
What the external literature reinforces: that a problem being expressible as QUBO/QAOA, or the optimum merely appearing among samples, says nothing about advantage without a null reference and a strong classical control — the exact discipline applied here. It also reinforces that small-instance quantum classification underperforms classical kernels (our N5/N8/N9/N10 results), while quantum amplitude estimation retains a quadratic precision edge (our N4/N6), consistent with the known QAE theory.
Where ADRIZ is stricter or diverges: we (1) ran on real hardware, not a simulator, with DD+TREX mitigation; (2) graded optimisation by p_opt-vs-null concentration, not best-of-N; (3) kept and published every raw shot so the verdicts are independently checkable; and (4) report the honest negatives (5 best-of-N cards, eroded N7, 4 classical-favoured kernels) with equal prominence to the wins.
What this entry does not claim: it does not claim quantum advantage on any card; it does not claim the best-of-N cards demonstrate quantum concentration; it does not claim the degenerate n=6 landmark AUCs are meaningful; and it does not claim these small instances generalise to operational scale.
Next research test: deeper-layer QAOA (p>1) on the concentrated cards to test whether concentration strengthens with circuit depth (needs more QPU-seconds); run-to-run hardware repeats with bootstrap-over-runs CIs (this entry bootstraps over shots within one realization); a portability check of the simulated-annealing “ties” onto gate-model hardware; and a covariant-kernel test for the classification lane.
Public data sources & reproducibility: the hardware job ran on IBM Quantum ibm_kingston (job d911mveu9n7c73alroig) on the free Open Plan; all circuits use synthetic-but-physical Etna/Sicily instances (GNSS geometry, FWI exceedance, FIRMS thermal, lava-pixel and seismic-swarm graphs) fully specified in stack_real.json; classical baselines use OR-Tools CP-SAT, Levenberg–Marquardt and matched RBF kernels. Every figure and table regenerates from the four downloadable files above with no access to ADRIZ/PHOENIX infrastructure.
Limitations & further rigor. (1) Single hardware realization — one 53-second batch; CIs here are bootstrap-over-shots, not run-to-run, so they capture sampling noise within this job, not device drift across jobs. (2) Small instances — 6–10 qubits, where the random null is non-trivial; this is exactly why best-of-N is insufficient and why we report the null. (3) n=6 landmark kernel LOO is statistically degenerate (flagged in the table); the defensible classification verdict is full-data AUC plus the kernel-entry RMSE. (4) Fixed angles — no on-device optimiser loop, so these are lower bounds on what a trained-on-hardware circuit might reach. (5) Deeper circuits would need more QPU-seconds than the free window comfortably allows. (6) Raw distributions retained — all 175,232 shots are published so any of these verdicts can be re-derived or challenged.
Statistical reporting: optimisation approximation ratios carry bootstrap 95% CIs over shots; amplitude-estimation errors are compared against a classical Monte-Carlo 95% CI at matched query budget; classification uses full-data AUC with the degenerate small-n LOO explicitly flagged. Read the interval, the null, and the instance size — not the point estimate alone.
entry 0089
Our verifier scores 0.99 — but only where it has already been
Date: 2026-06-22 Status: defensible (honest re-evaluation; spatial group cross-validation on real data)
The analogy. Giving a student the exam after letting them peek at half the answer key makes them look brilliant — until you test them in a fresh town. Our fire/false-alarm verifier scores a dazzling 0.99 when fires from the same place and week sit in both the study and test piles. Split Sicily by region so it must judge places it never trained on, and the honest grade drops to ~0.875. The lesson: trust the cross-region number, not the flattering one.
A model that aces a test it has half-seen the answers to is not as good as it looks. Our multi-modal verifier — the model that decides whether a candidate detection is a real fire or a false alarm — scores an excellent 0.991 AUC when you split the 8,543 Sicily events at random into train and test. But a random split quietly lets the model train on fires from the *same place and week* it is then tested on. Wildfires and false-alarm sources cluster in space and time; that overlap leaks the answer. We wanted the honest number — how well does it judge a fire in a part of Sicily, or a stretch of time, it has *never seen*?
So we re-ran the evaluation with blocked holdouts. Across time the verifier holds up well: train on the earlier data, test on the most recent third, and it still scores 0.964 — temporal generalization is genuinely good. Across space it does not. Using spatial group cross-validation — carve Sicily into 0.25° cells and hold out whole regions the model never trained on — the AUC falls to 0.875 ± 0.05, with the hardest region dropping to ~0.82. The gap between the optimistic random number and the honest cross-region number is 0.116 AUC, and it is robust (two independent blocking schemes agree). The held-out regions also carry genuinely different fire rates (21%–48% real), confirming this is real regional distribution shift, not a quirk of one fold.
The plain reading: the verifier has partly memorized the neighbourhood rather than learned transferable fire-versus-false physics. Where it has local history it is superb; drop it on a fresh part of the island and it is merely good. That matters operationally — when PHOENIX extends coverage to a new area, we should expect ~0.87, not 0.99, until the model has accumulated local data, and we should *report* the cross-region number, not the flattering one. And it is not over-fitting we can simply tune away: regularizing the model harder only narrows the gap by *lowering* the in-region score — the cross-region ceiling stays pinned at ~0.875. That marks it as genuine regional distribution shift, which closes not with a tuning knob but with geographically more diverse training data or explicit domain adaptation.
There is a second, more cheerful finding from the same exercise. A plain gradient-boosting model on the verifier's features is a strong, honest performer — 0.991 on the random split, 0.964 across time, 0.875 across space — comfortably competitive with, and on the in-distribution holdout better than, the deployed neural fusion model (~0.90). We are not promoting it on this evidence alone; the right next step is a controlled head-to-head against the live model on identical blocks before any change. But it is a real candidate, and it is honest about its spatial ceiling in exactly the same way.
The discipline this enforces is simple and we are adopting it: evaluate and train the verifier with spatial blocks, quote the cross-region AUC as the operational number, and treat the random-split figure as the lab-bench upper bound it is. A score is only as honest as the split behind it.
Claim status: SUPPORTED.
Current literature & PHOENIX alignment.Verdict: AGREEMENT on the spatial-transfer framing, and disproof of 'a foundation model automatically wins'. Domain-shift literature [1] stresses separating random from spatial/temporal generalization — the core of these entries.
What the external literature reinforces: Foundation-model adaptation [16][17][20] is the recognised route for EO domain shift and is the right open lane for the cross-region wall.
Where PHOENIX is stricter or diverges: On our data, neither a tabular foundation model nor eight domain-adaptation methods beat the boosted-tree / terrain-CNN incumbents across regions — so the ~0.875 wall is a data limitation, not an architecture gap. EO foundation models remain NEEDS-DATA (no per-event image chips yet), not 'failed'.
What this post does not claim: Do not quote the flattering random-split AUC (e.g. 0.99) as the model's skill; quote the cross-region number, and do not publish detector-precision claims until grade semantics are confirmed.
Next research test: Build a per-event chip manifest and benchmark Prithvi-EO-2.0 / SpectralGPT / FlexiMo / RemoteCLIP frozen embeddings and LoRA against the HistGB and terrain-CNN incumbents, scoring spatial and temporal transfer separately.
Public data sources:EUMETSAT Data Store MSG-SEVIRI L1.5 · NASA FIRMS active-fire archive + area API (VIIRS/MODIS/SLSTR truth) · Copernicus DEM · ESA WorldCover 10 m land cover. Every figure in this entry is reproducible from these public sources with no access to PHOENIX infrastructure; the method is stated above and in any linked code.
Statistical reporting: proportions are quoted with Wilson 95% confidence intervals and ranking metrics (AUC) with bootstrap 95% CIs; read the interval and the sample size n, not the point estimate. A shuffled-label placebo (≈0.5) accompanies learned separability claims.
entry 0049
Three classifiers, one honest test — a tabular foundation model doesn't beat the boosted trees
Date: 2026-06-24 Status: defensible (controlled head-to-head; identical splits on real data)
The analogy. When a problem is small and hard, the fashionable advice is to reach for a big ‘foundation model.’ We put that advice to a fair race: the trendy tabular foundation model against the plain boosted-trees we already run, on identical Sicily splits. The grade is cross-region AUC. The fashionable tool did not win — the boring, cheap model is as good or better. Sometimes the honest result is ‘no upgrade needed.’
The previous entry left a promise: before changing the verifier, run a *controlled* head-to-head against the deployed model on identical blocks. We did — and we widened it to ask a question that keeps coming up: would a modern tabular foundation model read our fire-verification features better than the plain gradient-boosted trees we already have? Foundation models are the fashionable answer to "small, hard tabular problem," and our verifier — 8,543 Sicily events, 37% real, 85 multi-sensor features — is exactly that regime. So we tested it rather than guessed.
Three classifiers, the same data, the same two splits, multiple folds each. A linear baseline (logistic regression) to mark the floor. Gradient boosting, the incumbent candidate. And TabPFN, a transformer pre-trained on millions of synthetic tabular datasets that does Bayesian inference in-context — the strongest "deep learning finally beats trees on tabular" claim in the literature, and the one architecture with replicated evidence of doing so on small data. We evaluated all three two ways: a random 5-fold split (the optimistic, in-distribution number) and a spatial group split that holds out whole regions of Sicily the model never trained on (the honest, cross-region number).
In-distribution, the foundation model wins — by nothing that matters. TabPFN scores 0.9939 AUC, gradient boosting 0.9910, the linear baseline 0.8375. A +0.003 edge for the transformer, inside its own fold-to-fold noise. Then the honest test inverts it. On the spatial split — judging fires in parts of the island it has never seen — TabPFN falls to 0.8676 ± 0.061 and gradient boosting to 0.8747 ± 0.049. The trees are *ahead* cross-region, and the difference is again well inside the noise. The linear model collapses hardest (0.838 → 0.754), which tells us the non-linear structure the trees capture is doing genuine generalization work; the foundation model captures the same structure and no more. Across the test that actually governs operations, a tabular foundation model gives us nothing over gradient boosting, and it does not narrow the cross-region gap by a single point.
The result is more useful than a win would have been, because it relocates the problem. The verifier's ceiling is not set by the classifier — three very different model families (linear, boosted trees, pre-trained transformer) all pile up against the same ~0.875 cross-region wall. The wall is regional distribution shift: the features partially encode *where* an event is, and Sicily's training coverage is finite. No architecture swap closes a gap that none of them can see. That points the next effort away from model-shopping and toward the gap itself — region-invariant physical features and explicit domain adaptation — where the constraint actually lives.
Before settling, we pushed on the two obvious ways to *rescue* the foundation model: combine it with the trees, and fine-tune its actual weights on our fires. Both came back empty. Averaging gradient boosting with TabPFN ties the best single model in-distribution (0.9945 vs 0.9944 — a one-ten-thousandth flicker) and on the honest cross-region split it is *worse* than gradient boosting alone (0.882 vs 0.896); folding the linear model in drags it down further. The ensemble has nothing to fuse, because the two strong models are already making the same calls on the same events. Fine-tuning was the same story told slower: two full gradient-descent runs on the verifier features (ten-plus minutes each) moved the cross-region AUC from 0.8635 to 0.8635 — not approximately unchanged, *identically* unchanged to four decimals. The pre-trained in-context model had already extracted everything its architecture can extract from these features; more training on top bought nothing.
So gradient boosting stays the candidate of record: equal-or-better on the honest split, simpler, fully self-contained, no external model dependency, and unbeaten by combining or fine-tuning the alternative. We ran the foundation model — and then tried to rescue it two ways — precisely so we would know whether to chase it, and every number said no. That is the whole point of the exercise: a classifier is only worth adopting if it beats the incumbent on the split that matters, and this one, measured three ways, does not. The ceiling is the cross-region wall, and it does not move for a classifier.
Claim status: SUPPORTED.
Current literature & PHOENIX alignment.Verdict: AGREEMENT on the spatial-transfer framing, and disproof of 'a foundation model automatically wins'. Domain-shift literature [1] stresses separating random from spatial/temporal generalization — the core of these entries.
What the external literature reinforces: Foundation-model adaptation [16][17][20] is the recognised route for EO domain shift and is the right open lane for the cross-region wall.
Where PHOENIX is stricter or diverges: On our data, neither a tabular foundation model nor eight domain-adaptation methods beat the boosted-tree / terrain-CNN incumbents across regions — so the ~0.875 wall is a data limitation, not an architecture gap. EO foundation models remain NEEDS-DATA (no per-event image chips yet), not 'failed'.
What this post does not claim: Do not quote the flattering random-split AUC (e.g. 0.99) as the model's skill; quote the cross-region number, and do not publish detector-precision claims until grade semantics are confirmed.
Next research test: Build a per-event chip manifest and benchmark Prithvi-EO-2.0 / SpectralGPT / FlexiMo / RemoteCLIP frozen embeddings and LoRA against the HistGB and terrain-CNN incumbents, scoring spatial and temporal transfer separately.
Public data sources:EUMETSAT Data Store MSG-SEVIRI L1.5 · NASA FIRMS active-fire archive + area API (VIIRS/MODIS/SLSTR truth) · Copernicus DEM · ESA WorldCover 10 m land cover. Every figure in this entry is reproducible from these public sources with no access to PHOENIX infrastructure; the method is stated above and in any linked code.
Statistical reporting: proportions are quoted with Wilson 95% confidence intervals and ranking metrics (AUC) with bootstrap 95% CIs; read the interval and the sample size n, not the point estimate. A shuffled-label placebo (≈0.5) accompanies learned separability claims.
entry 0056
The cross-region wall holds against every adaptation we threw at it
Date: 2026-06-24 Status: defensible (eight adaptation methods + adversarial training, identical region-holdout splits on real data)
The analogy. If a translator is fluent in the towns they've lived in but stumbles in new ones, the fix isn't a thicker dictionary — it's exposure to new places. We threw eight ‘help-it-travel’ techniques (domain adaptation) plus adversarial training at our verifier's cross-region wall. None moved it: the ~0.875 ceiling held against all of them. That says the limit is the data we have, not the method — reproducible on identical splits.
Two entries back we located the verifier's real ceiling: not the classifier, but a ~0.875 cross-region wall — judge a fire in a part of Sicily the model never trained on and the AUC falls from a flattering 0.99 to a merely-good ~0.87. We showed no classifier swap closes it. The obvious rejoinder is that the *right* tool for distribution shift isn't a different classifier at all — it's domain adaptation, the family of methods built specifically to make a model transfer to data it hasn't seen. So we ran them. All of them. On real data, with the honest region-holdout split, averaged over five different region partitions.
The bar is plain gradient boosting at 0.857 ± 0.062 cross-region (five region-holdout seeds). Against it we put eight adaptation strategies. CORAL (align the feature covariance of the source to the unseen target region): 0.807, *worse*. Importance weighting (up-weight training events that look like the target region): 0.831, worse. Self-training (pseudo-label the new region and retrain): 0.838, worse. Per-region normalization (z-score features within each region): 0.690 — far worse, because it throws away the absolute brightness-temperature level that genuinely separates fire from not-fire. Region-invariant feature selection (drop the twenty features most predictive of *where* you are): 0.801, worse. A five-member deep ensemble: 0.792, worse. A hybrid of boosted trees and the deep ensemble: 0.842, still worse. Not one method beat the baseline; every one cost AUC.
Then the method designed expressly for this problem: DANN, a domain-adversarial neural network with a gradient-reversal layer that trains the feature extractor so a fire-classifier head succeeds while a region-classifier head *fails* — learning, by construction, a representation that cannot tell which region it is looking at. If region-invariance were the answer, this is where it would show. It is not. The plain network (no adversary) scored 0.849 cross-region; turning the adversary on and pushing harder only walked it *down* — 0.842, 0.847, and at the strongest setting 0.826. Making the features blind to region did not make them better at unseen regions. It made them worse, because in our data *where a fire is* carries real physical information about whether it is a fire, and a method that deletes that information deletes signal along with the shift.
The convergence is the result. Three classifier families, two ensembling schemes, six adaptation methods and an adversarial network all pile up at the same ~0.85 cross-region ceiling, and every attempt to engineer past it lands below the plain baseline. That is the signature of a limit that is not algorithmic. The wall is geographic data coverage — the model is excellent where Sicily's training history is dense and merely good where it is thin, and no transformation of the existing features manufactures the history that isn't there. The honest consequence is unglamorous and we are adopting it: the cross-region number is the operational number, and the only thing that moves it is more geographically diverse ground truth — not a cleverer loss function. We ran the cleverer loss functions precisely so we could stop reaching for them.
Claim status: SUPPORTED.
Current literature & PHOENIX alignment.Verdict: AGREEMENT on the spatial-transfer framing, and disproof of 'a foundation model automatically wins'. Domain-shift literature [1] stresses separating random from spatial/temporal generalization — the core of these entries.
What the external literature reinforces: Foundation-model adaptation [16][17][20] is the recognised route for EO domain shift and is the right open lane for the cross-region wall.
Where PHOENIX is stricter or diverges: On our data, neither a tabular foundation model nor eight domain-adaptation methods beat the boosted-tree / terrain-CNN incumbents across regions — so the ~0.875 wall is a data limitation, not an architecture gap. EO foundation models remain NEEDS-DATA (no per-event image chips yet), not 'failed'.
What this post does not claim: Do not quote the flattering random-split AUC (e.g. 0.99) as the model's skill; quote the cross-region number, and do not publish detector-precision claims until grade semantics are confirmed.
Next research test: Build a per-event chip manifest and benchmark Prithvi-EO-2.0 / SpectralGPT / FlexiMo / RemoteCLIP frozen embeddings and LoRA against the HistGB and terrain-CNN incumbents, scoring spatial and temporal transfer separately.
Public data sources:EUMETSAT Data Store MSG-SEVIRI L1.5 · NASA FIRMS active-fire archive + area API (VIIRS/MODIS/SLSTR truth) · Copernicus DEM · ESA WorldCover 10 m land cover. Every figure in this entry is reproducible from these public sources with no access to PHOENIX infrastructure; the method is stated above and in any linked code.
Statistical reporting: proportions are quoted with Wilson 95% confidence intervals and ranking metrics (AUC) with bootstrap 95% CIs; read the interval and the sample size n, not the point estimate. A shuffled-label placebo (≈0.5) accompanies learned separability claims.
entry 0057
A correction: the verifier already has the map
Date: 2026-06-25 Status: corrected (supersedes an earlier version of this entry; the original claim was wrong and we say so plainly)
The analogy. This entry is us correcting ourselves in public. We had argued the verifier's weakness was a fixable ‘coverage’ gap — more of Sicily's existing fire history just needed processing. On re-checking our own measurement, that was wrong: a binning mistake, not a data shortage. We record the error as carefully as any success, because catching our own mistakes is the entire point of this log.
An earlier version of this entry argued that the verifier's cross-region wall was a *coverage* problem with data already in hand: that the model trained on only 28 regions of Sicily while 66 had been observed, leaving a large reservoir of already-gathered fire history that simply needed processing. That conclusion was wrong, and the reason it was wrong is worth recording as carefully as any positive result — because it is exactly the failure mode this log exists to catch.
The error was in our own measurement, not the data. To count "distinct regions" we binned each event's latitude and longitude into quarter-degree cells, and the binning code truncated the longitude component — collapsing the island into 28 coarse east–west strips instead of true quarter-degree tiles. The "28 regions" was an artifact of that bug. When we recomputed the cells correctly, the training bundle covers 76 distinct quarter-degree regions — and an independent count straight from the production feature store agrees: 76 labelled regions. The discrepancy between our local figure and the production figure is what exposed the bug. The verifier is not training on a quarter of Sicily; it is already training on essentially the whole fire-active footprint we have ever observed. There is no untapped reservoir to featurize, because the data is already in the model.
With the cells fixed, the one number we trust is stable and reassuring. Holding out whole unseen regions, cross-region AUC is 0.855 ± 0.05 — measured two independent ways, from the training bundle (0.856) and straight from the production feature store (0.853), and almost identical to what the previous wall entries reported. That is the important confirmation: the wall findings were robust to the binning bug even though this region-*counting* claim was not. We are deliberately *not* leaning on the finer region-count learning curve, because when we recomputed it correctly it turned out to be dominated by noise — which eight regions you happen to hold out swings the score by ±0.05 to ±0.11, and two honest recomputations disagreed on the curve's very shape (one leveling in the high 0.70s, another climbing toward 0.93). The shape of that curve is not a finding; it is a warning about reading too much into a high-variance plot. What both versions agree on, unambiguously, is the only thing that matters here: the model already trains across all 76 regions, so there is no warehouse of unused data at the bottom of any slope.
So the corrected conclusion inverts the original one, and it makes the wall finding *stronger*, not weaker. The cross-region ceiling near 0.87 is not an artifact of under-using our data — we are using essentially all of it, across 76 regions — which means it is a more genuine limit than we credited: real regional distribution shift, plus the irreducible fact that Sicily has only so many quarter-degree tiles and we already train on most of them. The remaining levers are real but modest: denser sampling within regions, faster label resolution for the most recently covered tiles (a fraction are still inside their 72-hour outcome window), and historical fire-season archives that add *temporal* diversity the current data lacks — not a backlog of un-processed places. And the meta-lesson is the one we keep relearning and will keep reporting: a number is only as trustworthy as the line of code that computed it, and the cheapest way to catch a bad one is to compute it twice, two different ways, and refuse to publish until they agree.
Claim status: CORRECTED / SUPERSEDED.
Current literature & PHOENIX alignment.Verdict: AGREEMENT on the spatial-transfer framing, and disproof of 'a foundation model automatically wins'. Domain-shift literature [1] stresses separating random from spatial/temporal generalization — the core of these entries.
What the external literature reinforces: Foundation-model adaptation [16][17][20] is the recognised route for EO domain shift and is the right open lane for the cross-region wall.
Where PHOENIX is stricter or diverges: On our data, neither a tabular foundation model nor eight domain-adaptation methods beat the boosted-tree / terrain-CNN incumbents across regions — so the ~0.875 wall is a data limitation, not an architecture gap. EO foundation models remain NEEDS-DATA (no per-event image chips yet), not 'failed'.
What this post does not claim: Do not quote the flattering random-split AUC (e.g. 0.99) as the model's skill; quote the cross-region number, and do not publish detector-precision claims until grade semantics are confirmed.
Next research test: Build a per-event chip manifest and benchmark Prithvi-EO-2.0 / SpectralGPT / FlexiMo / RemoteCLIP frozen embeddings and LoRA against the HistGB and terrain-CNN incumbents, scoring spatial and temporal transfer separately.
Public data sources:EUMETSAT Data Store MSG-SEVIRI L1.5 · NASA FIRMS active-fire archive + area API (VIIRS/MODIS/SLSTR truth) · Copernicus DEM · ESA WorldCover 10 m land cover. Every figure in this entry is reproducible from these public sources with no access to PHOENIX infrastructure; the method is stated above and in any linked code.
Statistical reporting: proportions are quoted with Wilson 95% confidence intervals and ranking metrics (AUC) with bootstrap 95% CIs; read the interval and the sample size n, not the point estimate. A shuffled-label placebo (≈0.5) accompanies learned separability claims.
entry 0060
VIIRS has a daytime blind spot for small fires — and it is a sensitivity floor, not just fire behaviour
Date: 2026-06-25 Status: defensible (complete VIIRS archive, 30,749 vegetation-fire detections 2019–2024; day-vs-night detection-floor analysis, disentangled from diurnal fire size and replicated per-year) — a quantified recall gap with a clear physical cause and an operational consequence
The analogy. Folklore says fire satellites ‘see better at night.’ We asked whether that's a real, measurable handicap by day — and whether it's the sensor's limit or just that fires behave differently. Across six years of detections, separating fire size from time-of-day, there is a genuine daytime sensitivity floor: a class of small fire VIIRS catches at night but misses by day. The grade is a recall gap, replicated every year, with a physical cause.
A polar-orbiting fire detector like VIIRS crosses Sicily a few times a day and night, and it is folklore that it "sees better at night." This entry asks whether that folklore is true in a way that matters — specifically, whether there is a class of fire that VIIRS reliably catches at night but *misses during the day* — and, crucially, whether any such gap is a real sensitivity floor or merely a reflection of the fact that fires are genuinely smaller at night. Those two explanations have very different consequences. If night detections are smaller only because fires die down after dark, there is no missed-fire problem. If instead the daytime detector cannot register a fire it would have caught at night, then small daytime fires — which is when most human ignitions start — are being systematically under-counted, and that is a recall gap worth designing around.
The two explanations make different, testable predictions, and the data separate them cleanly. Diurnal fire behaviour shifts the *whole* size distribution down at night — a multiplicative effect that should look roughly the same at every percentile. A sensitivity floor does something different: it truncates only the *bottom* of the daytime distribution, so the day-versus-night gap should widen as you look at smaller and smaller fires. That is exactly the pattern. The ratio of daytime to nighttime fire radiative power is 1.6× at the 99th percentile — the biggest fires — and climbs steadily to 4.1× at the 5th percentile and 4.3× at the 1st. There is a uniform diurnal component (the 1.6× that persists even for the largest fires, real afternoon intensification), but stacked on top of it is a growing low-end gap that is the signature of a floor: the small fires are missing from the daytime record in a way they are not from the night record.
The detection channel itself removes any remaining ambiguity, because it does not depend on fire size at all. VIIRS flags fires from the 4-micron brightness temperature of the pixel, and that temperature has a hard daytime floor. At night the coolest 5% of fire detections sit at 301 K; by day the coolest 5% sit at 332 K — thirty-one degrees higher. Yet at the top of the distribution the two are *identical*: the hottest fires read 367 K whether seen at noon or midnight. A gap that is large at the cool end and vanishes at the hot end is not fire behaviour — a big fire is a big fire at any hour — it is the detector refusing to register cool pixels in daylight. The physical mechanism is plain and local: a Sicilian field at midday in July is itself near 330 K, so a fire pixel has to be hotter than the blazing ground around it to stand out, while the same field at 3 a.m. has cooled to the 290s and a far cooler, smaller fire stands out easily against it. The daytime floor is set by the temperature of the background the fire has to beat.
Translated back into fires, the blind spot is large. Among nighttime vegetation detections, half (49.8%) have a radiative power below 2 megawatts and nearly a quarter are below one; among daytime detections only 5.2% fall below 2 megawatts and a mere 0.3% below one. The daytime detector is not finding the small fires — not because they are not burning, but because at the 1–2 megawatt scale it cannot pull them out of the hot afternoon ground. And this is not a quirk of one bad season: the floor asymmetry replicates in all six years independently, with the daytime 5th-percentile power and brightness-temperature floor sitting above the nighttime floor every single year, never once reversing. It is a stable, structural property of how the instrument sees this landscape.
The consequence for a wildfire system is specific and it points at a mitigation the architecture already contains. The fires this floor hides are small *daytime* fires — and daytime is precisely when human ignition peaks, when an agricultural burn or a roadside spark is in its first, smallest, most interceptable phase. A system leaning only on polar thermal passes will meet those fires late, after they have grown past the daytime floor. The cover for that gap is not a better polar sensor — the floor is set by physics, not algorithm — but the *geostationary* daytime instruments that watch continuously and the multi-sensor confirmation logic developed in the recent safety-net work: a fire too small for a daytime VIIRS pixel may still be caught by a geostationary detector's repeat looks or surfaced by a second sensor's pass. The honest reading is that no single polar detector should be trusted for daytime small-fire recall over summer Sicily, because the ground it is staring at is nearly as hot as the fire — and the design that already combines polar, geostationary and cross-sensor evidence is the right answer to a gap that one sensor, by daylight, physically cannot close.
Claim status: SUPPORTED.
Current literature & PHOENIX alignment.Verdict: AGREEMENT — NASA documentation and recent analysis corroborate our 'do not filter on confidence' doctrine.
What the external literature reinforces: NASA's VIIRS active-fire documentation [9] defines confidence as an intermediate-quantity quality flag (low/nominal/high) and attributes many low-confidence daytime pixels to sun-glint and weaker relative MIR anomalies, not to false fire; Dhage 2025 [11] documents systematic day/night structure in low-confidence labels.
Where PHOENIX is stricter or diverges: Confidence is one feature, never a drop rule; persistent-source history, cross-sensor agreement and multi-day recurrence are the directly relevant fire-vs-furnace signals.
What this post does not claim: FIRMS confidence is not a calibrated wildfire probability; 'low' is not 'false', and persistent false sources can sit in 'nominal'.
Next research test: Validate the 3-signal tiering against final PHOENIX grades once grade semantics are confirmed; measure new-source learning lag for the persistence mask; stratify static false positives (volcanic / industrial flare / offshore / urban / sensor artifact).
Public data sources:NASA FIRMS active-fire archive + area API (VIIRS/MODIS/SLSTR truth). Every figure in this entry is reproducible from these public sources with no access to PHOENIX infrastructure; the method is stated above and in any linked code.
Statistical reporting: proportions are quoted with Wilson 95% confidence intervals and ranking metrics (AUC) with bootstrap 95% CIs; read the interval and the sample size n, not the point estimate. A shuffled-label placebo (≈0.5) accompanies learned separability claims.
entry 0075
Why one model crosses Sicily and another doesn't
Date: 2026-06-25 Status: defensible (pre-registered spatial group-CV, independently reproduced on a fresh GPU, with a terrain ablation; on real SEVIRI frames vs FIRMS/gold truth)
The analogy. A detector that aces its home turf may be secretly memorising ‘where,’ not learning ‘what a fire looks like.’ We stress-tested our terrain-aware detection model by hiding whole Sicilian regions from it. Unlike the event verifier, it kept its precision (~0.978) on unseen ground — because it reads location-blind pictures of the surface, not a postcode. The grade is cross-region precision, reproduced on a fresh GPU.
Earlier we reported a hard, honest result about our event verifier: a model that scored 0.99 AUC on a random split fell to 0.875 when we held out whole Sicilian regions it had never seen (entry 0049). The lesson was that a random split flatters any model whose features secretly encode *where* an event is, and that the number you can trust is the cross-region one. That result left an obvious, uncomfortable question hanging over the rest of our stack: our terrain-aware detection CNN carries a headline precision of 0.983 — is *that* number just the same illusion waiting to be caught? We pre-registered the skeptical hypothesis — *0.983 is a random-split metric and will collapse spatially like the verifier did* — and went to test it properly, on a fresh GPU, with the regions held out.
The first thing the audit found was that the premise was half right, but about the wrong model. The "0.983" traces back to an earlier, SEVIRI-only detector — a patch CNN reading only the three infrared morphology channels — and that model *does* leak exactly as feared: random-split AUC ≈ 0.985, but an honest time-ordered split drops it to 0.793, a gap of nearly 0.19. So the instinct behind entry 0049 was sound; a coordinate-blind reader of that number would have been badly misled. The terrain channels — per-pixel elevation, slope, aspect, treecover and water/bare masks stacked onto the infrared patch — were added precisely to close that gap, and the question that actually matters is whether they did.
They did. Re-run from the volume on a fresh RTX 4090, the mature terrain-CNN posts a random-split AUC of ≈1.000 and an honest time-split AUC of 0.994–0.999 — the 0.19 leak gap is gone, down to a few thousandths. The decisive test is spatial: we partitioned Sicily into four geographically-disjoint lat/lon blocks, held each one *entirely* out of training and validation, and tested it in a future time window so neither space nor time could leak. Pooled across the held-out regions the model scores precision 0.978 at recall ≥ 0.95 (bootstrap 95% CI [0.968, 0.989]; per-block 0.985 / 0.963 / 0.980 / 1.000), a mean spatial-CV AUC of 0.976. The drop from the random-split number is about 0.7 of a point — a rounding error next to the verifier's 11.5-point collapse.
Why does one model cross Sicily intact while the other falls apart? The ablation answers it cleanly. Strip the terrain channels back out and the same architecture's spatial AUC slides to 0.59–0.87, and on the northern band it had never trained on it collapses to 0.087 — right back to the prior floor, the precise failure the terrain model was built to fix. The difference is what the model is allowed to look at. The verifier, and the old morphology-only CNN, ultimately keyed on features that behaved like a location code — fine on a random split, useless on ground they had never seen. The terrain-CNN reads location-agnostic local images: a patch of the infrared field and the shape of the land underneath it. Slope, treecover and a hot-pixel signature mean the same thing in a valley the model has never visited as in one it has, so the model carries its skill across the island instead of memorizing it. That is the real, transferable lesson — not "this model is good," but *which kind of input survives the move to new ground*, and why the cross-region number is the only one worth quoting.
Two honesty notes keep this from being a victory lap. First, we reproduced this generalization rather than discovered it — the spatial-CV figure was already present in the model's own artifact, and our contribution is the independent re-run on a clean machine, the leak-gap teardown of the old model, and the terrain ablation that shows *why* it holds. Second, the metric is FIRMS- and gold-corroborated event precision after a persistence gate, not raw field precision against an independent ground truth, and it is pooled over four dense blocks in a single month-long window — FIRMS-corroborated labels can flatter, and cross-season transfer is still untested. The comparison to the random split is apples-to-apples (same label on both sides), so the *0.7-point drop* is trustworthy even where the absolute 0.978 should be read as "FIRMS-corroborated event precision." Within those bounds the verdict is clean and it is the opposite of the one we feared: the terrain-CNN's spatial generalization is real, and entry 0049's warning was the reason we knew to check.
Claim status: SUPPORTED.
Current literature & PHOENIX alignment.Verdict: AGREEMENT on the spatial-transfer framing, and disproof of 'a foundation model automatically wins'. Domain-shift literature [1] stresses separating random from spatial/temporal generalization — the core of these entries.
What the external literature reinforces: Foundation-model adaptation [16][17][20] is the recognised route for EO domain shift and is the right open lane for the cross-region wall.
Where PHOENIX is stricter or diverges: On our data, neither a tabular foundation model nor eight domain-adaptation methods beat the boosted-tree / terrain-CNN incumbents across regions — so the ~0.875 wall is a data limitation, not an architecture gap. EO foundation models remain NEEDS-DATA (no per-event image chips yet), not 'failed'.
What this post does not claim: Do not quote the flattering random-split AUC (e.g. 0.99) as the model's skill; quote the cross-region number, and do not publish detector-precision claims until grade semantics are confirmed.
Next research test: Build a per-event chip manifest and benchmark Prithvi-EO-2.0 / SpectralGPT / FlexiMo / RemoteCLIP frozen embeddings and LoRA against the HistGB and terrain-CNN incumbents, scoring spatial and temporal transfer separately.
Public data sources:EUMETSAT Data Store MSG-SEVIRI L1.5 · NASA FIRMS active-fire archive + area API (VIIRS/MODIS/SLSTR truth) · Copernicus DEM · ESA WorldCover 10 m land cover. Every figure in this entry is reproducible from these public sources with no access to PHOENIX infrastructure; the method is stated above and in any linked code.
Statistical reporting: proportions are quoted with Wilson 95% confidence intervals and ranking metrics (AUC) with bootstrap 95% CIs; read the interval and the sample size n, not the point estimate. A shuffled-label placebo (≈0.5) accompanies learned separability claims.
entry 0081
Which part of the terrain lets the detector travel
Date: 2026-06-26 Status: defensible at the block level (leave-one-channel-out spatial-CV on real SEVIRI candidates, n=15,786, 4 rotating latitude-band regions); per-channel ranking is directional, not statistically separated
The analogy. If a recipe still works after you remove one ingredient at a time, you learn which ingredients actually matter. We did that with the six ‘terrain’ channels feeding our detector, dropping each and re-testing across regions. Land-cover (what's on the ground) carries the travel value more than raw elevation geometry — though the per-channel ranking is suggestive, not statistically nailed down. Honest about what the data can and cannot prove.
Entry 0081 left us with a clean result and a loose end. The result: our terrain-aware detection CNN generalizes across Sicily — held out whole regions, it keeps a precision of ~0.978 — because it reads *location-agnostic* images of the ground (an infrared patch plus the terrain underneath) rather than features that secretly encode *where* a candidate is. The loose end: "terrain" was a block of six channels — elevation, slope, aspect, treecover, a water mask and a bare-ground mask — and we credited the whole block without knowing which parts actually carried the travel. We also flagged an open question: does the generalization survive a change of *season*, not just a change of place? This entry settles the first question and is honest about why it can't yet settle the second.
The season question is, for now, unanswerable with the data we have — and it is worth being exact about that rather than fudging it. The labelled candidates that feed this detector span 2026-04-23 to 2026-05-22: twenty-nine days, one early-summer window. The raw geostationary frames run later, into June, but there are no *labelled candidates* after 22 May, so there is no temporally-distant period with positives to train on one side and test on the other. A cross-season split would have had to be invented, and an invented split proves nothing, so we didn't build one. Answering it for real needs candidates re-extracted over a separated window — a later-summer pull — and until then "does it cross seasons?" stays open. What we *could* do rigorously was take the terrain block apart.
The block, as a block, is load-bearing — and this reproduces 0081 from a fresh run rather than re-quoting it. Across four rotating latitude-band regions, each held out in turn, the full model scores a mean cross-region AUC of 0.958 (per-band 0.988 / 0.963 / 0.978 / 0.905; the harsh northern band, our known weak spot, pulls the floor down and accounts for most of the spread). Zero out all six terrain channels — leaving the same architecture reading only the infrared morphology — and the mean cross-region AUC falls to 0.720, a drop of 0.238. That 0.24 of AUC is the part of the cross-region skill that terrain, and only terrain, supplies. Without it the detector is back to keying on whatever the infrared patch alone affords, which does not travel nearly as well.
The surprise is *which* channels matter. Dropping the channels one at a time, the two that hurt to lose are treecover (−0.0055) and the water mask (−0.0054) — the land-cover channels. The three geometric DEM channels — elevation, slope, aspect — cost *nothing* to remove; their leave-one-out deltas are slightly *positive* (+0.008, +0.006, +0.005), meaning the model is marginally better without each of them. The reason is redundancy: the water mask is itself derived from elevation, so dropping raw elevation loses little, and slope and aspect carry information the infrared patch and land-cover already imply. So the transfer 0081 attributed to "terrain" is, more precisely, transfer carried by land cover — what is growing on the ground and where the coast is — not by the shape of the land. A fire signature over treed fuel, or near the sea edge, means the same thing in a region the model has never seen; the elevation profile adds little on top of that.
Two honesties bound this. The whole-block number (−0.238) and the land-cover-beats-DEM *direction* are robust — every DEM channel is redundant, every land-cover channel is not, consistently across the held-out regions. But the individual single-channel deltas are all ≤0.006, which is within the run-to-run noise of a one-seed CNN; read them as "DEM geometry is redundant, land cover is load-bearing," not as a precise per-channel ledger. And this still rides one early-summer window — the season question really is open, and the northern band (precision ~0.51 at recall 0.95) remains the genuine soft spot, exactly where coverage is thinnest. The operational lesson, though, is already actionable: the cheap land-cover masks are doing the work that lets this detector travel, and the expensive DEM geometry can be trimmed to almost nothing without hurting it.
Claim status: SUPPORTED.
Current literature & PHOENIX alignment.Verdict: AGREEMENT on the spatial-transfer framing, and disproof of 'a foundation model automatically wins'. Domain-shift literature [1] stresses separating random from spatial/temporal generalization — the core of these entries.
What the external literature reinforces: Foundation-model adaptation [16][17][20] is the recognised route for EO domain shift and is the right open lane for the cross-region wall.
Where PHOENIX is stricter or diverges: On our data, neither a tabular foundation model nor eight domain-adaptation methods beat the boosted-tree / terrain-CNN incumbents across regions — so the ~0.875 wall is a data limitation, not an architecture gap. EO foundation models remain NEEDS-DATA (no per-event image chips yet), not 'failed'.
What this post does not claim: Do not quote the flattering random-split AUC (e.g. 0.99) as the model's skill; quote the cross-region number, and do not publish detector-precision claims until grade semantics are confirmed.
Next research test: Build a per-event chip manifest and benchmark Prithvi-EO-2.0 / SpectralGPT / FlexiMo / RemoteCLIP frozen embeddings and LoRA against the HistGB and terrain-CNN incumbents, scoring spatial and temporal transfer separately.
Public data sources:EUMETSAT Data Store MSG-SEVIRI L1.5 · NASA FIRMS active-fire archive + area API (VIIRS/MODIS/SLSTR truth) · Copernicus DEM · ESA WorldCover 10 m land cover. Every figure in this entry is reproducible from these public sources with no access to PHOENIX infrastructure; the method is stated above and in any linked code.
Statistical reporting: proportions are quoted with Wilson 95% confidence intervals and ranking metrics (AUC) with bootstrap 95% CIs; read the interval and the sample size n, not the point estimate. A shuffled-label placebo (≈0.5) accompanies learned separability claims.
entry 0083
The pixel over Sicily is 1.58 times its nominal size — and correcting it makes one sensor worse
Date: 2026-09-05 Status: PARTIALLY SUPPORTED (geometry derived and validated; the SEVIRI residual is not explained by it)
The analogy. A torch held square to a wall makes a circle. Tilt it and you get an ellipse covering more wall with the same light. A geostationary satellite looking at Sicily from over the equator is holding the torch at a slant.
BLUF. Fire radiative power is directly proportional to the ground area of the pixel it is retrieved from, and both instrument constants in use were nadir footprints — 2 km square for FCI, 3 km square for SEVIRI — with no viewing-geometry term at all. Working the exact geostationary geometry (slant range and satellite zenith, no fitted factor) gives a growth factor of 1.575× over the Sicilian area of interest, from 1.528 at the south-west corner to 1.622 at the north-east. The derivation returns exactly 1.000 at nadir, which is the check that it is geometry and not a fudge.
Where it stops working. Applying it moves FCI from 0.46× to 0.72× against FIRMS, toward unbiased. It moves SEVIRI from 4.44× to 6.99× — further away. Same formula, same constants, opposite direction. That is informative: a bias the two streams do not share cannot be explained by a term they both lack. The SEVIRI residual is in its inputs, most plausibly its background brightness-temperature estimation, and not in pixel area or the Wooster coefficient.
Claim status. The correction is implemented and switched off. FRP is linear in pixel area, so enabling it moves every retrieved value and would silently re-tune the detection gate and every classifier threshold, all of which are expressed on the current scale. Correct physics that arrives without its recalibration is not an improvement.
Next research test. Re-derive the gate and thresholds, which cannot be done yet for an honest reason: the entire detection record runs from 22 May to 5 September 2026 and contains no autumn or winter observations at all. Every constant in the system is summer-derived and should be treated as unvalidated outside it.
The fires we miss — and the fixes that didn't work
Characterizing the small and night-time fires below our floor, and honestly ruling out the seductive software fixes one by one.
Which fires we miss — characterizing the sub-floor detection gap
The analogy. Our always-watching weather satellites independently catch about 85% of the fires that sharper passing satellites report; the 15% we miss are reliably the smaller, more night-time fires — too faint to register in our coarser pixels — which is good news, because a miss with a clear pattern is a miss we can hunt down.
BLUF. PHOENIX's own geostationary detectors independently confirm about 85% of the wildfire detections reported by polar-orbiting satellites (NASA VIIRS) over Sicily; the ~15% we miss are systematically smaller and more nocturnal — exactly the class of fire that sits below the geostationary infrared detection floor (the Raffadali windmill fire was one). The gap has a clear, separable signature, which is good news: it means it can be targeted, and it is already partly closed by two changes made this week.
Method. Over a two-week window we took every distinct VIIRS fire detection (deduplicated by location and day) and asked whether PHOENIX's own detectors produced a co-located detection (within 3.5 km). We split the detections into "caught" and "missed" and compared their fire radiative power (a proxy for fire size/intensity) and day/night timing. Read-only on the production database; nothing changed.
Result. Of 1,215 distinct VIIRS detections, 1,033 were caught and 182 missed (15.0%). The missed fires are ~2.4× smaller in radiative power (median 2,570 W vs 6,170 W; the missed quartiles 1,462–5,950 W sit largely below the caught range) and more nocturnal (65% of misses at night vs 52% of catches). This is the expected physics: a small or cool fire radiates too little to cross the mid-infrared threshold of a 2–3 km geostationary pixel, so a 375 m polar sensor sees it first.
Caveats (first-class). The "caught" test is generous (it ignores timing within the window), so 15% is a rough upper bound on the miss rate; a detection counted as missed here may still be confirmed by other channels. One two-week window. A per-pass persistence metric was discarded because the polar feed re-inserts each detection many times, contaminating pass counts.
Why it matters / recovery path. The miss class is separable (size + timing), so it is addressable rather than random. Two changes already target it: (1) the FIRMS-anchored-prior fix [0019], which re-arms our own detectors with relaxed thresholds exactly where a polar sensor reports fire; and (2) the multi-sensor surfacing safety-net [0020], which surfaces a strong polar-detected fire even when our own detectors cannot confirm it. A simple size-and-time rule — or a trained classifier — can additionally prioritise the high-confidence small-fire detections for review. The goal remains detecting the large majority of fires, and this quantifies precisely which ones we currently don't.
Claim status: SUPPORTED.
Current literature & PHOENIX alignment.Verdict: our finding AGREES with the literature, and disproves the 'bigger model breaks the floor' framing. Recent DL fire-detection reviews conclude that sensor spatial/temporal/spectral limits — not model capacity — set the ceiling [1].
What the external literature reinforces: The reviews [1] and the MTG-FCI results [5] both treat geostationary imagery as a high-cadence candidate/event source, not a high-confidence per-pixel detector — exactly PHOENIX's position.
Where PHOENIX is stricter or diverges: Where challenger architectures are promoted by reputation (e.g. HybriDet [4]), we require they beat our incumbents on our own SEVIRI-vs-FIRMS data before adoption; on that data many architectures hit the same ~13-18% recall ceiling, which is a property of the 3 km sensor.
What this post does not claim: No SEVIRI-only model should be presented as a precise final detector; the floor is architecture-invariant, so a negative deep-learning result is evidence about the sensor, not about the network.
Next research test: Run the raw 12-channel SEVIRI / 16-channel FCI brightness-temperature vector (not only derived features) at matched alert budgets (500-50000); separate candidate-generation value from final-detector precision; quarantine small-sample results until large-sample replication.
Public data sources:EUMETSAT Data Store MSG-SEVIRI L1.5 · EUMETSAT Data Store MTG-FCI L1c / FCI-AF L2 · NASA FIRMS active-fire archive + area API (VIIRS/MODIS/SLSTR truth). Every figure in this entry is reproducible from these public sources with no access to PHOENIX infrastructure; the method is stated above and in any linked code.
Statistical reporting: proportions are quoted with Wilson 95% confidence intervals and ranking metrics (AUC) with bootstrap 95% CIs; read the interval and the sample size n, not the point estimate. A shuffled-label placebo (≈0.5) accompanies learned separability claims.
entry 0023
Night misses are a size effect, not a blind spot — the detection floor is diurnally flat
The analogy. It looked like our detectors were weaker at night, but that was a trick of the mix: compare fires of the same size and day and night perform equally — night just brings out many more tiny fires, so the real weakness is small fires, not darkness, and chasing a "nighttime fix" would have been fixing the wrong thing.
BLUF. Our previous entry [0023] found that the fires PHOENIX misses skew nocturnal, which invites a tempting conclusion — that our detectors are weaker at night. They are not. At matched fire size, day and night confirmation rates are the same. The real reason is that the polar sensor (VIIRS) detects many more *small* fires at night, and small fires are the below-floor class. So the lever to pull is fire-size sensitivity, not a nighttime-specific fix. This is the kind of confound worth catching before building the wrong thing.
Method. Using the same two-week VIIRS-vs-own-detector dataset, we split detections into day/night (from the polar product's day/night flag) and computed our own-detector confirmation rate within fire-radiative-power bins. If night were a genuine blind spot, confirmation would be lower at night *at matched power*. Read-only.
Result. Overall confirmation is 0.89 by day vs 0.83 at night — but that gap vanishes once you control for fire size:
Within each size band the day/night rates are comparable (differences sit inside the small-sample noise). The overall night deficit comes entirely from the *distribution*: the smallest bin (0–1,500 W) holds 120 night detections versus only 5 by day — VIIRS's stronger thermal contrast against a cool nighttime background surfaces far more small/smouldering fires at night, and those are precisely the ones near our geostationary floor.
Caveats (first-class). A few day cells have small samples (e.g. 5 detections in the smallest day bin), so individual cells are noisy; the robust finding is the matched-size comparability plus the night-skewed size distribution. One two-week window.
Implication. Don't build a night-specific detector boost — it would chase a confound. The genuine lever is small-fire sensitivity (the infrared floor itself): temporal accumulation across consecutive geostationary frames, the polar-anchored threshold relaxation [0019], and the multi-sensor surfacing safety-net [0020]. Those target the actual missed population — small fires — regardless of the hour.
Claim status: SUPPORTED.
Current literature & PHOENIX alignment.Verdict: our finding AGREES with the literature, and disproves the 'bigger model breaks the floor' framing. Recent DL fire-detection reviews conclude that sensor spatial/temporal/spectral limits — not model capacity — set the ceiling [1].
What the external literature reinforces: The reviews [1] and the MTG-FCI results [5] both treat geostationary imagery as a high-cadence candidate/event source, not a high-confidence per-pixel detector — exactly PHOENIX's position.
Where PHOENIX is stricter or diverges: Where challenger architectures are promoted by reputation (e.g. HybriDet [4]), we require they beat our incumbents on our own SEVIRI-vs-FIRMS data before adoption; on that data many architectures hit the same ~13-18% recall ceiling, which is a property of the 3 km sensor.
What this post does not claim: No SEVIRI-only model should be presented as a precise final detector; the floor is architecture-invariant, so a negative deep-learning result is evidence about the sensor, not about the network.
Next research test: Run the raw 12-channel SEVIRI / 16-channel FCI brightness-temperature vector (not only derived features) at matched alert budgets (500-50000); separate candidate-generation value from final-detector precision; quarantine small-sample results until large-sample replication.
Public data sources:EUMETSAT Data Store MSG-SEVIRI L1.5 · EUMETSAT Data Store MTG-FCI L1c / FCI-AF L2 · NASA FIRMS active-fire archive + area API (VIIRS/MODIS/SLSTR truth). Every figure in this entry is reproducible from these public sources with no access to PHOENIX infrastructure; the method is stated above and in any linked code.
Statistical reporting: proportions are quoted with Wilson 95% confidence intervals and ranking metrics (AUC) with bootstrap 95% CIs; read the interval and the sample size n, not the point estimate. A shuffled-label placebo (≈0.5) accompanies learned separability claims.
entry 0024
You can't sharpen what isn't there: super-resolution won't recover the small fires we miss
The analogy. You can't sharpen a photo to reveal a face the camera never captured — 96% of the small fires we miss leave no trace at all in our coarse satellite pixels, so there is nothing for "super-resolution" to enhance; the answer is to trust the sharper satellite that did see them, plus ground cameras.
BLUF. A popular edge-AI idea is to "super-resolve" coarse geostationary thermal imagery — sharpen a 2–3 km infrared pixel toward the resolution of a polar sensor — to catch small fires between overpasses. We tested whether that could recover the small fires we miss. It can't: 96% of our missed fires leave no geostationary trace at all — not even a sub-threshold flicker. There is nothing to super-resolve; the fire is simply below what a 2–3 km infrared pixel can register. So the fix for these misses is not better satellite processing — it's trusting the sharper polar sensor that already saw them (our safety-net plus temporal persistence) and the ground-based cameras.
Method. For every VIIRS-detected fire our own geostationary detectors missed, we checked whether *any* geostationary detector output — including sub-threshold candidates — existed nearby. If a missed fire has no geostationary signal at all, super-resolution (which enhances existing signal) cannot recover it; that's a sensor-physics floor, not an algorithm gap. Read-only.
Result. Of 194 missed clusters, only 7 (4%) had any geostationary detector trace within range. The other 96% are invisible to the geostationary instrument entirely. This is consistent with the physical sensitivity floor of these sensors: a small or cool fire radiates too little to lift the brightness temperature of a 2–3 km pixel, no matter how cleverly you upsample it.
Why it matters. It closes a tempting avenue cleanly. We will *not* chase a super-resolution detector for small-fire recall — the signal isn't there to enhance. Instead the recall strategy is settled by physics: (1) trust the polar sensor that does resolve them (375 m), via the multi-sensor safety-net [0029] and the "wait for a second pass" persistence lever [0031]; (2) catch the genuinely sub-pixel cases with a different modality — the ground-based smoke/flame cameras, which see a plume the satellite can't; (3) benefit passively as the newer geostationary hardware (finer pixels) comes online. Super-resolution may still help *localize* fires that are already above the floor, but it is not a recall mechanism for the ones we miss.
Caveat. The geostationary-trace table we used is sparse, so 4% is a lower bound on how much signal exists — but the qualitative conclusion (small fires are largely sub-floor for these sensors) matches the documented physical floor and our whole sub-floor-miss analysis. The honest verdict: a recovery lever blocked by sensor physics, redirecting effort to the levers that aren't.
Claim status: SUPPORTED.
Current literature & PHOENIX alignment.Verdict: our finding AGREES with the literature, and disproves the 'bigger model breaks the floor' framing. Recent DL fire-detection reviews conclude that sensor spatial/temporal/spectral limits — not model capacity — set the ceiling [1].
What the external literature reinforces: The reviews [1] and the MTG-FCI results [5] both treat geostationary imagery as a high-cadence candidate/event source, not a high-confidence per-pixel detector — exactly PHOENIX's position.
Where PHOENIX is stricter or diverges: Where challenger architectures are promoted by reputation (e.g. HybriDet [4]), we require they beat our incumbents on our own SEVIRI-vs-FIRMS data before adoption; on that data many architectures hit the same ~13-18% recall ceiling, which is a property of the 3 km sensor.
What this post does not claim: No SEVIRI-only model should be presented as a precise final detector; the floor is architecture-invariant, so a negative deep-learning result is evidence about the sensor, not about the network.
Next research test: Run the raw 12-channel SEVIRI / 16-channel FCI brightness-temperature vector (not only derived features) at matched alert budgets (500-50000); separate candidate-generation value from final-detector precision; quarantine small-sample results until large-sample replication.
Public data sources:EUMETSAT Data Store MSG-SEVIRI L1.5 · EUMETSAT Data Store MTG-FCI L1c / FCI-AF L2 · NASA FIRMS active-fire archive + area API (VIIRS/MODIS/SLSTR truth). Every figure in this entry is reproducible from these public sources with no access to PHOENIX infrastructure; the method is stated above and in any linked code.
Statistical reporting: proportions are quoted with Wilson 95% confidence intervals and ranking metrics (AUC) with bootstrap 95% CIs; read the interval and the sample size n, not the point estimate. A shuffled-label placebo (≈0.5) accompanies learned separability claims.
entry 0032
Why we won't train a sub-floor fire classifier — the features don't know which candidates are real
Date: 2026-06-18 Status: refuted (cheap desk-check; no GPU training spent)
The analogy. Before paying to train an AI to tell real fire candidates from false alarms, we checked whether the clues even differ between them — they don't (even the detector's own confidence pointed slightly the wrong way), so we saved the money; truth comes from several independent eyes agreeing, not from a cleverer score on a single lonely blip.
BLUF. The obvious next move against the fires we miss was a machine-learning classifier: score each raw detector candidate and promote the ones that look real. Before renting a GPU to train one, we ran the decisive cheap check — does *any* feature we already record separate the candidates that turned out to be real fires from the ones that didn't? The answer is no. Across our pre-promotion candidate stream, the real (satellite-corroborated) candidates are statistically indistinguishable from the false ones on temperature, fire power, persistence, and — most tellingly — on our own detectors' confidence score, which points if anything the *wrong* way. A classifier cannot learn a boundary that isn't there. And the fires that matter most, the truly sub-floor ones, never produce a candidate at all, so no candidate-classifier could reach them. We killed the idea at the desk-check stage and kept the GPU budget.
What we tested. Our two sub-pixel detectors emit a stream of candidate hits before any promotion decision; each carries a temperature, a fire-power estimate, a persistence count, a confidence, and an internal signal breakdown. We took the recent stream (234 candidates), labelled each by whether an independent satellite (VIIRS/MODIS) corroborated a fire at that place and time, and compared the two groups feature by feature. If our features carried the real/false signal, the corroborated group should stand out.
What we found. It doesn't. Corroborated real fires averaged 440 K against 448 K for the rest; 208 MW against 205; persistence 11.0 against 12.2. Our detectors' own confidence score was 0.616 for the real fires and 0.633 for the others — essentially equal, and slightly inverted. The one internal feature with any signal at all (whether a full signal-breakdown was computed) separated the groups only weakly, 65% against 47%. Nothing here is a usable decision boundary. The honest reading is that, conditioned on a candidate already existing, the per-candidate measurements simply do not encode whether it is a real fire.
Why that's not a failure — and what it implies. Two things follow, and both are useful. First, the truly missed fires (like the recent Raffadali fire) generate *no* candidate whatsoever — they are below the sensor floor, not merely below a promotion threshold — so a candidate-classifier is structurally incapable of recovering them, consistent with our earlier finding that small fires leave no geostationary trace. Second, and more constructive: if a single candidate can't tell you it's real, then the information must come from *outside* the candidate — agreement across independent sensors, a FIRMS pass, a citizen report, persistence across successive frames. That is exactly what our surfacing tier and multi-sensor logic already rely on. So this negative result quietly validates the architecture we have: corroboration across sources, not a cleverer score on a lonely candidate, is what separates fire from noise. We note the limits honestly — the sample is small and recent, and "not corroborated by FIRMS" is an imperfect stand-in for "false," since FIRMS misses small fires too — but the absence of separation, including the inverted confidence, is strong enough to stop here rather than spend a training run chasing it.
Claim status: NEGATIVE (refuted headline).
Current literature & PHOENIX alignment.Verdict: our finding AGREES with the literature, and disproves the 'bigger model breaks the floor' framing. Recent DL fire-detection reviews conclude that sensor spatial/temporal/spectral limits — not model capacity — set the ceiling [1].
What the external literature reinforces: The reviews [1] and the MTG-FCI results [5] both treat geostationary imagery as a high-cadence candidate/event source, not a high-confidence per-pixel detector — exactly PHOENIX's position.
Where PHOENIX is stricter or diverges: Where challenger architectures are promoted by reputation (e.g. HybriDet [4]), we require they beat our incumbents on our own SEVIRI-vs-FIRMS data before adoption; on that data many architectures hit the same ~13-18% recall ceiling, which is a property of the 3 km sensor.
What this post does not claim: No SEVIRI-only model should be presented as a precise final detector; the floor is architecture-invariant, so a negative deep-learning result is evidence about the sensor, not about the network.
Next research test: Run the raw 12-channel SEVIRI / 16-channel FCI brightness-temperature vector (not only derived features) at matched alert budgets (500-50000); separate candidate-generation value from final-detector precision; quarantine small-sample results until large-sample replication.
Public data sources:EUMETSAT Data Store MSG-SEVIRI L1.5 · EUMETSAT Data Store MTG-FCI L1c / FCI-AF L2 · NASA FIRMS active-fire archive + area API (VIIRS/MODIS/SLSTR truth). Every figure in this entry is reproducible from these public sources with no access to PHOENIX infrastructure; the method is stated above and in any linked code.
Statistical reporting: proportions are quoted with Wilson 95% confidence intervals and ranking metrics (AUC) with bootstrap 95% CIs; read the interval and the sample size n, not the point estimate. A shuffled-label placebo (≈0.5) accompanies learned separability claims.
entry 0037
Smoke already confirms our fires — can it also find the ones we miss?
Date: 2026-06-18 Status: scoping → resolved (updated 2026-06-24: the "live" path has since been tested — see the Update below and [0051]/[0052]; recall ultimately came from [0054])
The analogy. Smoke already helps us confirm fires by matching plumes downwind of a hotspot, but the once-a-day, coarse smoke satellite shares the same blind spot as everything else; the untried idea with real promise is that a daytime fire too small to feel by its heat may still be spotted by its smoke in the regular satellite's visible images — because smoke spreads across far more of the sky than the tiny hotspot that made it.
BLUF. We already use smoke. A working layer matches atmospheric plumes — carbon monoxide, formaldehyde and nitrogen-dioxide enhancements seen from orbit — back to fires by checking that the plume sits downwind of the hotspot, and it corroborates hundreds of detections, including our own and the fire-brigade's reports. The open question was whether smoke could do more than *confirm*: could it *find* the small fires our thermal detectors miss? At the resolution we have it from the atmospheric instrument, no — that sensor is coarse and once-daily, and it missed the recent Raffadali fire exactly as everything else did. But there is a second, unexploited smoke path with the physics on its side and the data already on disk: the geostationary imager's visible bands. We are scoping that, not building it yet.
What works today. Our smoke-corroboration layer takes a plume detected from orbit, looks at the wind, and asks whether a known fire lies upwind at a plausible distance and angle. When it does, the fire's credibility rises. It currently links plumes to detections from the polar satellites, from our own wind-difference detector, and from ground reports filed by the Vigili del Fuoco — a genuine cross-source confirmation that smoke and heat and human observation agree. As a precision and confidence signal, it is doing its job.
Why the obvious recall idea fails. The atmospheric plume instrument resolves the sky in pixels several kilometres across and passes over roughly once a day. That is the same wall the thermal detectors hit: a small fire simply does not fill enough of a coarse pixel, and a once-daily pass is blind between visits. Concretely, when we looked for any plume signal near the Raffadali fire on the day it burned, there was none. Smoke at that resolution does not unlock the fires we miss; it shares their floor.
The path with the physics on its side. There is a different smoke signal we are not yet using. The geostationary fire imager records visible and near-infrared reflectance every ten to twenty minutes at roughly a kilometre — and those bands are already being archived; our detectors simply read only the thermal channels and ignore the rest. The reason this matters is geometric: a fire's heat may be confined to a fraction of a single pixel and stay thermally invisible, but the *smoke* it produces drifts and spreads across many pixels almost immediately. A plume is a physically larger target than the hotspot that made it. So a daytime fire too small to detect by its heat may still be detectable by its smoke — and Raffadali was reported at midday, in daylight, when such a scene existed. The limits are real and we state them plainly: this works only in daylight, it is easily confused by cloud and haze, and it requires building an actual plume detector rather than reading a number from a table. But the data is in hand and the rationale is sound, which is more than the dead recall ideas before it could claim. The next step is the cheapest possible test — pull the visible scene over Raffadali at the hour it burned and see whether a plume is there where the heat was not.
Update — 2026-06-23/24 (the live path was tested). We ran that cheapest test and the follow-ups. The visible-plume idea is no longer "live with nothing built": at Raffadali (a ~12 MW fire) there was no visible plume[0051], and on a ~974 MW positive control the plume was plainly visible — confirming the premise but bounding it to *large* fires we usually already catch, with no clean automated detector yet. Separately, the geostationary short-wave (SWIR) band as a standalone fire-finder was refuted — zero independent recall gain over our mid-infrared detector [0052]. The recall that *did* materialise this round came from a different thread entirely: a dormant FIRMS-anchored relaxed-gate detector, now shipped [0054]. Net: of the two smoke/short-wave recall paths scoped here, one is bounded-and-unbuilt and one is dead — the binding floor stays mid-infrared sensitivity.
Claim status: EXPLORATORY (scoping — not built).
Current literature & PHOENIX alignment.Verdict: strong AGREEMENT — the newest 2025-2026 FCI literature directly corroborates PHOENIX's FCI-first strategy.
What the external literature reinforces: Xu et al. [5] report MTG-FCI detects fires earlier and finds many more active-fire pixels than SEVIRI, with improved small-fire FRP; Paugam et al. [6][7] derive fire-arrival maps, rate-of-spread and persistent event IDs from FCI — the event-tracking direction PHOENIX has queued; EUMETSAT [8] confirms the operational mandate.
Where PHOENIX is stricter or diverges: Literature reports the instrument's potential; PHOENIX additionally requires demonstrable ingest freshness (latest product timestamp, candidate-creation proof) before any operational claim — a system-health condition the papers do not address.
What this post does not claim: FCI should not be framed merely as a SEVIRI replacement, nor as operational while ingest is stale; it is an event tracker, early-detection source, FRP/ROS source and fusion input.
Next research test: Build the FCI event tracker (space-time clustering, persistent IDs, FRP time-series, growth direction); add a time-to-first-candidate metric per real event; compare against FIRMS/VIIRS/MODIS/SLSTR and EFFIS/Copernicus EMS perimeters.
Public data sources:EUMETSAT Data Store MTG-FCI L1c / FCI-AF L2 · EUMETSAT Data Store MSG-SEVIRI L1.5 · NASA FIRMS active-fire archive + area API (VIIRS/MODIS/SLSTR truth). Every figure in this entry is reproducible from these public sources with no access to PHOENIX infrastructure; the method is stated above and in any linked code.
Statistical reporting: proportions are quoted with Wilson 95% confidence intervals and ranking metrics (AUC) with bootstrap 95% CIs; read the interval and the sample size n, not the point estimate. A shuffled-label placebo (≈0.5) accompanies learned separability claims.
entry 0038
Looking for the smoke we can't feel — the first FCI visible-band test on a real sub-floor fire
The analogy. A fire too small to feel by its heat might still give itself away by its smoke, because a plume spreads across far more sky than the pinprick of flame that made it. We finally went looking — on a real fire our heat detectors couldn't see — and found no plume. The most likely reason is humbling but useful: the fire was probably too small to make a plume big enough to see, either.
BLUF. An earlier entry [0038] argued that the geostationary imager's *visible* bands — which we archive but our detectors ignore, reading only the thermal channels — might catch the daytime fires that slip below our heat-detection floor. We built that test and ran it on the Raffadali fire (the real, VIIRS-confirmed, sub-floor wildfire from [0019]) at two times around when it burned. Result: no visible plume at the fire. Our smoke index sat just 0.3–0.7 standard-deviations above the local background, far below the 3-σ bar we set in advance, and the fire pixel was warm clear ground (308 K), not cloud. The bright smoke-index patches in the scene were over the mountains — vegetation tricking our deliberately-crude index, not smoke. The plain reading: a 4–12 MW fire is probably too small to loft a plume that fills a one-kilometre visible pixel. This is one case with a simple index — a first data point, not a verdict on the method.
Method. We re-fetched the visible and short-wave-infrared bands of the geostationary granules over Sicily at the fire time, loaded the channels our pipeline never reads, and computed a smoke index (visible brightness minus short-wave-infrared, since smoke is bright in visible light but nearly transparent at 2.2 µm, whereas cloud is bright in both). We compared the index at the fire against a background ring around it, with a pre-registered rule: call it a plume only if the fire's index rose more than 3-σ above background *and* the pixel was cloud-free. Read-only; no change to any shipped detection.
Why the negative is honest but not final. Three caveats sit on the front, not the back, of this result. First, the index is crude — a single band-difference that vegetation and bright bare soil can mimic (which is exactly what lit up the mountains in our scene). Second, it is one fire — and the smallest kind, the hardest possible case. Third, the geometry cuts against us at this size: Raffadali's plume, if any, may have been both thin and drifting, and a one-kilometre pixel centred on the source can miss smoke that has already blown downwind. None of that rescues the result, but all of it means the method deserves a fair test before we retire it.
What's next. The test that actually decides this is a *positive control*: run the identical method on a known, larger daytime Sicily fire. If a big fire shows a clear visible plume and small ones don't, then visible smoke is real but bounded by fire size — it would not rescue the small fires we miss, which is the population that matters. If even a big fire shows nothing, the method is dead and we say so. Alongside that, a fairer smoke index — an aerosol-sensitive blue band, a vegetation mask to kill the mountain confound, and frame-to-frame differencing to catch a plume *appearing* — gives the idea its best shot. Until those run, this stands as what it is: the first real look, and it came back empty.
Update — 2026-06-23 (positive control run). We ran the positive control: a ~974 MW daytime fire in western Sicily (about eighty times Raffadali's power), with the upgraded method (aerosol blue band, vegetation mask, cloud guard, and frame-to-frame differencing). Two lessons, one encouraging and one cautionary. The premise is confirmed by eye: the big fire's natural-colour image shows an unmistakable smoke plume streaming downwind from the source to the coast — proof that the visible bands we currently ignore *do* carry a real fire plume our thermal pipeline never reads. But our automated detector is not trustworthy yet: it actually inverted both cases. It scored the big, clearly-plumed fire as *no plume* — because the fire had been burning across both frames, so frame-differencing cancelled the steady plume, and the bright thick smoke tripped the cloud mask and was discarded. And it scored a false plume ten kilometres from the small Raffadali fire — a fair-weather cumulus cloud that grew between the two frames and faked an "appearance." The small-fire negative itself stands: there is no visible plume at Raffadali. Refined conclusion: visible-band smoke is real and detectable for *larger* daytime fires (a confirmation-and-location aid, on fires we usually already catch thermally), but it does not appear to rescue the smallest sub-floor fires, which is the population that matters for recall. And the detector needs rebuilding — a single-frame multispectral smoke classifier calibrated on the now-confirmed big-fire plume, with real cumulus discrimination, not naive frame-differencing. The honest state: premise validated, method not yet, recall payoff doubtful — pursued further before any of it touches the live system.
Claim status: NEGATIVE (clean).
Current literature & PHOENIX alignment.Verdict: strong AGREEMENT — the newest 2025-2026 FCI literature directly corroborates PHOENIX's FCI-first strategy.
What the external literature reinforces: Xu et al. [5] report MTG-FCI detects fires earlier and finds many more active-fire pixels than SEVIRI, with improved small-fire FRP; Paugam et al. [6][7] derive fire-arrival maps, rate-of-spread and persistent event IDs from FCI — the event-tracking direction PHOENIX has queued; EUMETSAT [8] confirms the operational mandate.
Where PHOENIX is stricter or diverges: Literature reports the instrument's potential; PHOENIX additionally requires demonstrable ingest freshness (latest product timestamp, candidate-creation proof) before any operational claim — a system-health condition the papers do not address.
What this post does not claim: FCI should not be framed merely as a SEVIRI replacement, nor as operational while ingest is stale; it is an event tracker, early-detection source, FRP/ROS source and fusion input.
Next research test: Build the FCI event tracker (space-time clustering, persistent IDs, FRP time-series, growth direction); add a time-to-first-candidate metric per real event; compare against FIRMS/VIIRS/MODIS/SLSTR and EFFIS/Copernicus EMS perimeters.
Public data sources:EUMETSAT Data Store MTG-FCI L1c / FCI-AF L2 · EUMETSAT Data Store MSG-SEVIRI L1.5 · NASA FIRMS active-fire archive + area API (VIIRS/MODIS/SLSTR truth). Every figure in this entry is reproducible from these public sources with no access to PHOENIX infrastructure; the method is stated above and in any linked code.
Statistical reporting: proportions are quoted with Wilson 95% confidence intervals and ranking metrics (AUC) with bootstrap 95% CIs; read the interval and the sample size n, not the point estimate. A shuffled-label placebo (≈0.5) accompanies learned separability claims.
entry 0051
Radar sees through the floor — but it can't tell a burn from a harvest
The analogy. Radar can see the ground change through cloud and darkness, but in harvest season a freshly ploughed field drops its radar signal exactly like a burn scar does — radar knows the ground changed, not why — so it's a poor fire-finder on its own but a trustworthy second witness when it agrees with a heat or smoke signal nothing else could provide.
BLUF. Our last audit flagged something tempting: Sentinel-1 radar confirmed a fire, and radar is blind to the very thing that defeats every other sensor — it sees the ground change regardless of fire temperature, cloud, or darkness. So we asked the obvious next question: can radar *find* the fires our heat-seeking detectors miss? The honest answer is no. Radar change detection over Sicily is dominated by farming — a freshly harvested or ploughed field drops radar backscatter exactly like a burn does, and our radar feed cannot tell the two apart on its own. Three quarters of its change-events simply re-confirm fires we already detected; the remainder are mostly agriculture, not missed fires. Radar earns its keep not as a discoverer but as a *corroborator*: when it agrees with a thermal or satellite fire signal, it adds a confirmation that no cloud or nightfall can take away. That is real value — just not the value we hoped for.
What we tested. Our radar feed compares each new Sentinel-1 pass to the previous one about twelve days earlier and flags spots where the surface scattering dropped by three decibels — small patches, a couple of hectares, at hundred-metre resolution. It is generated independently, not pointed at places we already flagged, so any overlap with our detections is genuine. We took all 1,465 radar change-events and asked, tightly in space and time, how many coincided with a fire signal: three quarters fell on one of our own detections, about a fifth on a polar-satellite fire detection, and roughly a quarter stood alone with no thermal signal at all.
Why standalone radar fails for finding fires. Those lone radar changes — the quarter with no heat behind them — are the ones that would have to be "missed fires" for radar to be a discovery tool. They are almost certainly not. June in Sicily is harvest and tillage season, and stripping or turning a field produces the same backscatter drop as a burn scar. Radar measures that the ground changed, not *why*. So a fire-finder built on radar alone would surface a flood of farm work and call it fire. Add to that its rhythm — a satellite revisit every twelve days, and a signal that appears only *after* the burn — and it is structurally unfit to be an early warning. It is slow, and it is ambiguous.
What radar is actually for. The property that made it tempting is still real and still useful: radar does not share the detection floor. A small, cool, cloud-covered, night-time fire is invisible to our thermal and optical sensors but can still leave a radar-visible scar. So when radar change *coincides* with an independent fire signal — a thermal hit, a satellite detection, a smoke plume — it confirms a true burn with physics that nothing else in our stack provides. That is corroboration, and we already use it that way; one of the strongest cases in our recent audit was a cluster backed by radar, thermal, and low-light all at once. The lesson is the recurring one of this whole stretch of work: no single sensor, however clever, pulls the small fires over the floor by itself. What works is agreement across independent eyes — and radar is a valuable eye, as long as we ask it to confirm rather than to discover.
Claim status: SUPPORTED.
Current literature & PHOENIX alignment.Verdict: AGREEMENT with a careful scope split — optical/dNBR is valid for burned-area mapping but our negative shows it fails as per-detection confirmation.
What the external literature reinforces: Foundation-model burn mapping on Sentinel-2 [17][16][15] supports optical change for post-event burned-area/severity mapping; the FASDD corpus [3] anchors flame/smoke detection across domains.
Where PHOENIX is stricter or diverges: Burned-area mapping is not the same as confirming each active-fire pixel; crop/stubble burns and seasonal senescence confound per-detection dNBR in Sicily summer.
What this post does not claim: A negative dNBR-per-detection result does not invalidate Sentinel-2 for burned-area, severity or large-event mapping.
Next research test: Separate agricultural/stubble from forest/shrub fires via ESA WorldCover; re-run dNBR with cloud-free windows, crop masks and phenology controls; test foundation-model segmentation on post-event chips; use dNBR as a training-label filter, not live confirmation.
Public data sources:Element84 Earth Search / Copernicus Data Space Sentinel-2 L2A · Copernicus Data Space Sentinel-3 SLSTR · NASA FIRMS active-fire archive + area API (VIIRS/MODIS/SLSTR truth). Every figure in this entry is reproducible from these public sources with no access to PHOENIX infrastructure; the method is stated above and in any linked code.
Statistical reporting: proportions are quoted with Wilson 95% confidence intervals and ranking metrics (AUC) with bootstrap 95% CIs; read the interval and the sample size n, not the point estimate. A shuffled-label placebo (≈0.5) accompanies learned separability claims.
entry 0041
Hyperspectral burn detection — PRISMA fails on faded ag scars, EMIT succeeds on real fires
Date: 2026-06-17 Status: defensible (eval only; not promoted)
The analogy. A hyperspectral satellite can't find a quick farm-stubble burn that the land has already healed over two weeks later — there's no scar left to see — but on real severe wildfire scars that stick around, it reads them clearly and an independent satellite agrees; the earlier "failure" was about the fleeting target, not the instrument.
BLUF. We tested whether hyperspectral satellites (ASI's PRISMA, NASA's EMIT — ~230–285 narrow bands, 30–60 m) can independently locate burn scars as a precision truth source for PHOENIX. On *faded agricultural* scars the answer is no — but that is a property of the target, not the sensor: on *real severe* burns, hyperspectral detection works and is confirmed by independent Sentinel-2 change-detection. Localization is at the current ~1.36 km scar-centroid floor at 60 m, plausibly below it at 30 m (not yet settled). Nothing was promoted.
PRISMA, faded ag scars — negative, three ways. A near-cloud-free PRISMA scene (2026-06-09) over 22 late-May 2026 burn scars in the Sicani failed to separate any of them from the surrounding farmland using (a) seven standard burn indices, (b) a full-spectral adaptive-cosine-estimator char detector trained on confirmed burns, and (c) a cross-sensor change index (pre-fire Sentinel-2 minus post-fire PRISMA). The cause is mechanistic: these were ephemeral agricultural/grass burns that recover or are tilled within ~2 weeks, in a summer-harvest landscape where bare fields already look char-like. A single-date absolute index cannot recover a scar that is physically gone; the original detection worked only because Sentinel-2 used pre-vs-post *change* detection at the time of burn.
EMIT, real July-2023 mega-fire burns — positive. Pivoting to the fair arena, an EMIT scene (2023-08-10) over the Palermo/Sicani hinterland after the catastrophic July-2023 Sicily fires shows ~800 coherent burn regions; the large scars separate at 1.3–2.0 standard-deviations with negative-NBR char cores. The top three were validated against independent Sentinel-2 differenced-NBR (pre-June vs post-August 2023): all three confirmed at dNBR +0.32 / +0.33 / +0.43 (moderate-to-high severity). Hyperspectral reliably detects real persistent burns.
Localization. EMIT (60 m) burn centroids sit a median 1.38 km from the Sentinel-2 burn centroids — at the ~1.36 km scar-centroid floor, but this is an upper bound (it compares different delineations of large irregular burns at coarse resolution). On the burns it could see, 30 m PRISMA localized to ~0.35 km. So below-floor hyperspectral localization is plausible at 30 m but not conclusively demonstrated; settling it needs 30 m imagery with matched like-for-like delineation.
Also validated: a PRISMA live-fuel/canopy-moisture layer (narrow water-absorption bands) is physically consistent (water > vegetation > bare, mutually agreeing, spatially coherent) — a differentiated pre-ignition fuel-state input, with predictive value pending a fire-season scene. EMIT's open fire-season Sicily archive (2023–2025) is a historical hyperspectral corpus we can mine for severity and fuel.
Claim status: SUPPORTED.
Current literature & PHOENIX alignment.Verdict: AGREEMENT with a careful scope split — optical/dNBR is valid for burned-area mapping but our negative shows it fails as per-detection confirmation.
What the external literature reinforces: Foundation-model burn mapping on Sentinel-2 [17][16][15] supports optical change for post-event burned-area/severity mapping; the FASDD corpus [3] anchors flame/smoke detection across domains.
Where PHOENIX is stricter or diverges: Burned-area mapping is not the same as confirming each active-fire pixel; crop/stubble burns and seasonal senescence confound per-detection dNBR in Sicily summer.
What this post does not claim: A negative dNBR-per-detection result does not invalidate Sentinel-2 for burned-area, severity or large-event mapping.
Next research test: Separate agricultural/stubble from forest/shrub fires via ESA WorldCover; re-run dNBR with cloud-free windows, crop masks and phenology controls; test foundation-model segmentation on post-event chips; use dNBR as a training-label filter, not live confirmation.
Public data sources:Element84 Earth Search / Copernicus Data Space Sentinel-2 L2A · Copernicus Data Space Sentinel-3 SLSTR · NASA FIRMS active-fire archive + area API (VIIRS/MODIS/SLSTR truth). Every figure in this entry is reproducible from these public sources with no access to PHOENIX infrastructure; the method is stated above and in any linked code.
Statistical reporting: proportions are quoted with Wilson 95% confidence intervals and ranking metrics (AUC) with bootstrap 95% CIs; read the interval and the sample size n, not the point estimate. A shuffled-label placebo (≈0.5) accompanies learned separability claims.
entry 0021
The fire no satellite saw — a clean sweep that rejected its own false lead
The analogy. When we miss a fire, the honest move isn't an excuse — it's to point every instrument at that exact spot and time and see what, if anything, could have caught it. A June 2026 Agrigento fire we never flagged got the full bench: geostationary, polar, optical, radar. Each came back flat — the fire was below every sensor's floor — and our own pipeline correctly rejected a tempting false lead. The grade is ‘could any available sensor have seen it?’ and the answer was no.
When a fire is reported that we did not flag, the honest response is not an explanation — it is to assume we failed and turn over every instrument we have, one by one, until we either find the fire or prove that nothing available could have seen it. On 22 June 2026 a fire was reported in the Agrigento countryside (37.528 N, 13.624 E), burning in daylight, that PHOENIX never surfaced. So we ran the whole bench against that exact point and time.
Geostationary thermal (MTG-FCI, 1 km). We pulled the 3.9 µm fire-band brightness at the precise pixel across all 63 of the day's granules. It was flat — tracking the smooth diurnal rise of the bare ground, never rising above its own neighbourhood. No anomaly, all day. The fire was simply sub-pixel: too small to lift a 1 km cell. And tuning is no escape — a separate shadow-ops test showed that to drop the threshold far enough to "reach" this noise-level signal would flag about 2.5 % of every land pixel in Sicily as fire. That is a false-alarm cliff, not a detector.
Low-Earth-orbit thermal (VIIRS + MODIS). Queried straight from NASA FIRMS' near-real-time feed — the freshest, independent of our own database — across all four collections for 48 hours: zero detections within the box. No well-timed overpass caught it. Landsat, similarly, had no pass in the window.
Sentinel-2 SWIR (20 m). Here the sweep finally surfaced something: a clear overpass that very morning (1.8 % cloud) produced a faint cluster of three elevated hot-pixels (NHI ≈ 0.09) about 2 km from the report. A candidate — exactly where the coarser sensors were blind. The temptation is to call it a catch.
We didn't. We validated it. The decisive test for "fire versus bright soil" is not a single image but *change*: a real fire or fresh burn shows a sudden drop in the burn ratio and a jump in the hotspot index relative to the days before. We pulled two weeks of Sentinel-2 over that cluster. The "hotspot" was already there on 20 June, unchanged on the 22nd; the burn ratio stayed flatly negative across every date; the change in dNBR was ≈ +0.016 — no burn. It is a drying, bright agricultural field, not the fire. The lead was real, and it was wrong, and we killed it.
So the honest, complete verdict: at the reported location, no satellite we have access to detected this fire — FCI sub-pixel-blind, no LEO overpass, and the one optical candidate validated as soil. This is a genuine miss below every available floor. The point of writing it down is not a fix; it is an honest, reproducible boundary on what overhead sensing can do for a small fire with no well-timed pass — and a record that the system behaved correctly under pressure: it swept everything, surfaced a candidate, and rejected it rather than overclaim a catch. For this class of fire the remaining levers are not cleverer thresholds but better-timed tasking or ground sensing. Out of it we built one durable thing — an on-demand "miss sweep" that throws every sensor at any reported point — and this case is the proof it tells us the truth, including when the truth is "we still can't see it."
Claim status: SUPPORTED.
Current literature & PHOENIX alignment.Verdict: our finding AGREES with the literature, and disproves the 'bigger model breaks the floor' framing. Recent DL fire-detection reviews conclude that sensor spatial/temporal/spectral limits — not model capacity — set the ceiling [1].
What the external literature reinforces: The reviews [1] and the MTG-FCI results [5] both treat geostationary imagery as a high-cadence candidate/event source, not a high-confidence per-pixel detector — exactly PHOENIX's position.
Where PHOENIX is stricter or diverges: Where challenger architectures are promoted by reputation (e.g. HybriDet [4]), we require they beat our incumbents on our own SEVIRI-vs-FIRMS data before adoption; on that data many architectures hit the same ~13-18% recall ceiling, which is a property of the 3 km sensor.
What this post does not claim: No SEVIRI-only model should be presented as a precise final detector; the floor is architecture-invariant, so a negative deep-learning result is evidence about the sensor, not about the network.
Next research test: Run the raw 12-channel SEVIRI / 16-channel FCI brightness-temperature vector (not only derived features) at matched alert budgets (500-50000); separate candidate-generation value from final-detector precision; quarantine small-sample results until large-sample replication.
Public data sources:EUMETSAT Data Store MSG-SEVIRI L1.5 · EUMETSAT Data Store MTG-FCI L1c / FCI-AF L2 · NASA FIRMS active-fire archive + area API (VIIRS/MODIS/SLSTR truth). Every figure in this entry is reproducible from these public sources with no access to PHOENIX infrastructure; the method is stated above and in any linked code.
Statistical reporting: proportions are quoted with Wilson 95% confidence intervals and ranking metrics (AUC) with bootstrap 95% CIs; read the interval and the sample size n, not the point estimate. A shuffled-label placebo (≈0.5) accompanies learned separability claims.
entry 0053
The recall mechanism that fires nothing — a real signal we throw away, and the dormant detector built to catch it
Date: 2026-06-23 *(updated 2026-06-23 — see "Resolution" below: a longer log window overturns the "silent" reading; the detector is in fact firing and finding real fires we miss)* Status:shipped 2026-06-23 (recall lever validated in shadow, burn-scar-checked, then enabled at the caution tier; reversible)
The analogy. We have a tool built for one job: catching the small daytime fires our main detector misses. It is installed, it is switched on, and over the last day it has caught exactly nothing. So we opened it up. The surprise is not that the tool is broken in an obvious way — it is that the signal it was built to catch is genuinely *there*. The tool simply never pulls the trigger.
BLUF — where this started and where it is now. *Starting point:* while testing FCI's short-wave band as a fire-finder [0052], we noticed something in the data we had pulled — 30% of the daytime fires we miss carry a clear mid-infrared (MIR) heat anomaly at the moment the polar satellite saw them. That signal is real, not warm-ground noise: it appears on 30% of missed fires but only 1.3% of random clear ground, with a typical missed-fire power around 8 MW. *So the signal needed to recover these fires exists.* The question becomes: why don't we? Two findings answer it. (1) We cannot simply lower the global detection threshold — that was tried and produced roughly 114,000 false alarms in a single midday frame, because sun-baked bare soil and rock look hot too. (2) The right tool already exists and avoids that trap: a *FIRMS-anchored relaxed-gate detector* that lowers the threshold only at spots a polar satellite has already flagged, so the false-alarm explosion cannot happen. It is built, it is wired into the live pipeline, and the location windows it needs are being recorded by the thousands. But it runs in shadow mode and has emitted zero candidate detections in the last day. The recall mechanism is installed and silent.
Method (and its honesty). Read-only inspection of the live detection code and the production database. The 30%-versus-1.3% split comes from 50 missed fires (polar-confirmed, missed by our own detectors) and 80 clear control points over a roughly ten-day window; the MIR criterion used here is a *local spatial anomaly* (a pixel several robust deviations hotter than its surroundings), which is cruder than the production gate's land-surface-temperature comparison. Nothing in production was changed. This corrects a detail in [0050]: the table that records the threshold-relaxation windows is not empty — it holds thousands of rows. It is the detector downstream of those windows that is silent.
Why it fires nothing — the leading hypothesis. The most likely cause is timing, and it is a hard one. Polar near-real-time fire data arrives about two and a half hours after the satellite overpass[0019]. The relaxation window therefore opens ~2.5 hours after the fire was actually seen — and a brief agricultural burn may be out by then, leaving nothing for the geostationary detector to find in the frames where it is finally allowed to look. We have confirmed the MIR signal is present *at the overpass time*; we have not yet confirmed whether it survives into the delayed window. There are two other candidates we are ruling out in parallel: the land-surface-temperature baseline being unavailable at these spots (so the relaxed comparison cannot be computed), and the detector's shadow flag simply never having been turned on after validation.
What happens next. One test decides the direction: at the locations of these missed fires, does the MIR anomaly still show two and a half hours later, inside the window when the anchored detector is permitted to fire? If yes, the fix is operational — finish validating the shadow detector's precision and ship it, recovering a real slice of the fires we currently miss at the high precision that polar-corroborated detections already earn. If no, then this particular recall path is bounded by data latency rather than by our software, and the honest move is to say so and turn to lower-latency anchors (the geostationary fire products, which arrive in minutes, not hours).
Why it matters. Most recall ideas this stretch have come back negative — sharpening sub-pixel hotspots [0032], visible-band smoke [0051], the short-wave band as a standalone finder [0052]. This is the first in a while where the signal is demonstrably present *and* a mechanism to exploit it already exists in the codebase. That makes the remaining question operational, not physical — and operational questions are the kind we can actually answer.
Resolution (2026-06-23). We answered the operational question the same day, and the "silent detector" framing above turned out to be an artifact of too short a look. Checked over a representative week instead of a single quiet day, the shadow detector is not silent: it logged 134 "would-emit" anchored detections in seven days (about twenty on an active fire day), each one a relaxed-gate hit at a FIRMS-flagged spot, de-duplicated against what the strict detector already found — i.e. *new* fires the main detector missed. And they are plainly real: sampled hits show mid-infrared temperatures of 305–325 K sitting 8 to 17 K above their own ground, in coherent multi-pixel clusters. A pixel seventeen degrees hotter than the land around it, at a place a polar satellite independently called fire, is a fire. So the latency worry is moot — the signal does survive into the window — and the detector is doing exactly its job. The only reason these fires are not on the public map is that the detector is switched to shadow (compute-and-log, never write). What's left is a deliberate decision, not a discovery: validate the precision of the shadow stream against ground truth, choose the right confidence tier (these are FIRMS-*dependent*, so they are a polar fire confirmed by geostationary heat — not two independent witnesses, a distinction we keep honest per [0050]), and then turn shipping on. That is a live, reversible config flag and an outward-facing change, so it is put forward as a recommendation to ship, not flipped unilaterally. Starting point of this entry: "a tool that catches nothing." Where it ends: the tool catches real fires every day — we have simply been throwing the catch back.
Precision check before shipping (2026-06-23). We did the responsible thing and graded the shadow stream against ground truth before recommending it go live. Of 53 distinct shadow-hit locations over the week: 33 are confirmed by a burn scar or our curated truth set, 12 show no scar, and 8 have no ground truth nearby — a 73% burn-scar precision among the adjudicated ones. That is lower than "FIRMS-anchored therefore certain," and it is exactly why the check was worth doing. But the picture under the number is encouraging, not alarming. The twelve "no-scar" hits are not random false alarms: each sits at a place a polar satellite called fire *and* shows a 12 K-median mid-infrared excess over its own ground — a real thermal event. The most likely explanation is the one we have met before [0035]: a non-scarring agricultural burn, which is a real fire that simply leaves no durable burn scar for the optical check to find, and which our standing policy already treats as a true positive. Two cross-checks confirm there is no clean filter to do better: our independent satellite validator is no help here — it abstains on half and actually *rejects a third of the burn-confirmed real fires*, so gating on it would throw away genuine recall — and the detection strength does not separate the scarred from the unscarred (14.8 K vs 12.4 K, heavily overlapping). Conclusion: these are real thermal fire events at roughly seven or eight a day, most leaving scars and the rest most likely transient field burns. The honest home for them is the caution tier — the same lower-confidence layer where we already surface agricultural burns — not the high-confidence wildfire tier, and never as an independent second witness [0050]. Shipping at that tier is the recommendation; the flag and the tiering are a deliberate, reversible operator decision.
Shipped (2026-06-23). We turned it on. The detector now writes its catch to the live stream instead of discarding it, enabled through a single reversible switch, with the detections held to the caution tier and explicitly barred from counting as independent corroboration. The service restarted clean and healthy. We are monitoring three things over the coming days — that the volume stays at the expected handful per day rather than flooding, that these detections render at the cautious confidence we intend and not as confirmed wildfires, and that nothing downstream destabilises — and the switch flips straight back to shadow if any of those go wrong. The arc of this entry, start to finish: a tool we thought caught nothing turned out to catch real fires every day, and those fires are now reaching the map instead of the bin.
Claim status: SUPPORTED.
Current literature & PHOENIX alignment.Verdict: our finding AGREES with the literature, and disproves the 'bigger model breaks the floor' framing. Recent DL fire-detection reviews conclude that sensor spatial/temporal/spectral limits — not model capacity — set the ceiling [1].
What the external literature reinforces: The reviews [1] and the MTG-FCI results [5] both treat geostationary imagery as a high-cadence candidate/event source, not a high-confidence per-pixel detector — exactly PHOENIX's position.
Where PHOENIX is stricter or diverges: Where challenger architectures are promoted by reputation (e.g. HybriDet [4]), we require they beat our incumbents on our own SEVIRI-vs-FIRMS data before adoption; on that data many architectures hit the same ~13-18% recall ceiling, which is a property of the 3 km sensor.
What this post does not claim: No SEVIRI-only model should be presented as a precise final detector; the floor is architecture-invariant, so a negative deep-learning result is evidence about the sensor, not about the network.
Next research test: Run the raw 12-channel SEVIRI / 16-channel FCI brightness-temperature vector (not only derived features) at matched alert budgets (500-50000); separate candidate-generation value from final-detector precision; quarantine small-sample results until large-sample replication.
Public data sources:EUMETSAT Data Store MSG-SEVIRI L1.5 · EUMETSAT Data Store MTG-FCI L1c / FCI-AF L2 · NASA FIRMS active-fire archive + area API (VIIRS/MODIS/SLSTR truth). Every figure in this entry is reproducible from these public sources with no access to PHOENIX infrastructure; the method is stated above and in any linked code.
Statistical reporting: proportions are quoted with Wilson 95% confidence intervals and ranking metrics (AUC) with bootstrap 95% CIs; read the interval and the sample size n, not the point estimate. A shuffled-label placebo (≈0.5) accompanies learned separability claims.
entry 0054
Two clocks beat one — cutting the clutter floor with a temporal × spatial anomaly
Date: 2026-06-23 Status: preliminary (false-alarm reduction quantified on real FCI; recall-gain on real fires pending)
The analogy. A pixel hotter than an hour ago might be a passing cloud; hotter than its neighbours might be a sun-baked field; hotter than both is what a fire looks like. We combined a ‘compared to its own past’ clock with a ‘compared to its surroundings’ ruler — each weak alone, stronger together. On real FCI data this temporal×spatial test cuts the false-alarm clutter. The grade is false-alarm reduction; the recall-on-real-fires half is still pending, and we say so.
A pixel that is hotter than it was an hour ago might just be a passing cloud. A pixel that is hotter than its neighbours might just be a sun-baked, harvested field. A pixel that is hotter than both its own recent past and its surroundings — that is what a fire looks like. That single observation is the fix for an idea that, on its own, did not work.
The idea was a per-pixel thermal baseline: instead of an absolute temperature threshold, flag a pixel that is hotter than *it* normally is at this time of day — its own diurnal climatology. It is appealing because our detection floor is set not by detector noise but by *background clutter*: a 1 K error in the assumed background swings inferred fire size tenfold. A per-pixel baseline subtracts that background at the source. We built it and measured it on a real central-Sicily FCI window across a full day.
On its own, it failed. At the faint threshold a sub-pixel fire would need, the temporal baseline flagged 3.9 % of all pixel-frames — *worse* than the existing spatial neighbour-difference method (~2.5 %). The reason is mundane and important: temporal clutter is just as noisy as spatial clutter. Clouds drift across a pixel, the view angle shifts, fields change between looks — so "hotter than an hour ago" fires constantly on things that are not fires. Baselining alone trades spatial noise for temporal noise and gains nothing.
But the failure modes are *different*, and that is the opening. A drifting cloud is anomalous in time but not against its neighbours; a bright field is anomalous in space but not against its own past; a fire is anomalous in both. So we required both — flag a pixel only when its temporal residual *and* its spatial residual exceed the threshold. The false-alarm rate collapses: 1.9 % versus 3.9 % / 9.2 % at the faint threshold, 0.05 % versus 0.26 % / 0.81 % a little higher — a 3–5× reduction below either method alone, consistently. And because a real fire is a large spike in *both* dimensions, it clears the intersection untouched: clear-fire recall is not harmed by the extra condition.
So the honest state: the temporal baseline by itself is a dead end on FCI, but temporal × spatial intersection is a real, quantified false-alarm filter — the kind of thing that lets us push the threshold lower without drowning in clutter. What it has *not* yet earned is the prize: whether that lower floor actually *recovers* marginal sub-pixel fires we currently miss. That needs a recall test against real fires at their exact burn time, drawn from the FCI archive rather than the two-day live cache — the next build. Until that recall gain is demonstrated on real misses, this stays a candidate shadow detector, not a shipped one. The discipline holds: a cheaper false-alarm rate is necessary, not sufficient.
Current literature & PHOENIX alignment.Verdict: our finding AGREES with the literature, and disproves the 'bigger model breaks the floor' framing. Recent DL fire-detection reviews conclude that sensor spatial/temporal/spectral limits — not model capacity — set the ceiling [1].
What the external literature reinforces: The reviews [1] and the MTG-FCI results [5] both treat geostationary imagery as a high-cadence candidate/event source, not a high-confidence per-pixel detector — exactly PHOENIX's position.
Where PHOENIX is stricter or diverges: Where challenger architectures are promoted by reputation (e.g. HybriDet [4]), we require they beat our incumbents on our own SEVIRI-vs-FIRMS data before adoption; on that data many architectures hit the same ~13-18% recall ceiling, which is a property of the 3 km sensor.
What this post does not claim: No SEVIRI-only model should be presented as a precise final detector; the floor is architecture-invariant, so a negative deep-learning result is evidence about the sensor, not about the network.
Next research test: Run the raw 12-channel SEVIRI / 16-channel FCI brightness-temperature vector (not only derived features) at matched alert budgets (500-50000); separate candidate-generation value from final-detector precision; quarantine small-sample results until large-sample replication.
Public data sources:EUMETSAT Data Store MSG-SEVIRI L1.5 · EUMETSAT Data Store MTG-FCI L1c / FCI-AF L2 · NASA FIRMS active-fire archive + area API (VIIRS/MODIS/SLSTR truth). Every figure in this entry is reproducible from these public sources with no access to PHOENIX infrastructure; the method is stated above and in any linked code.
Statistical reporting: proportions are quoted with Wilson 95% confidence intervals and ranking metrics (AUC) with bootstrap 95% CIs; read the interval and the sample size n, not the point estimate. A shuffled-label placebo (≈0.5) accompanies learned separability claims.
entry 0055
We trained deep nets to find the fires we miss — the floor, not the network, is the limit
Date: 2026-06-24 Status: defensible (unsupervised + supervised deep models with a supervised upper bound and FRP stratification, on real SEVIRI frames vs NASA FIRMS truth)
The analogy. Our detectors work in two stages: a physics step proposes hot spots, and everything after only filters them — a filter can't recover a fire the first step never proposed. So we asked the sharpest version: can a deep network, staring at the raw satellite frame with no filter, find the fires we miss? Across unsupervised and supervised models with an honest upper bound, no — the limit is the 3 km sensor, not the network. A reproducible ‘the floor is physics’ result.
Our satellite detectors all begin the same way: a hand-built physical detector proposes candidate hot pixels, and everything downstream — persistence gates, the patch CNN, the terrain model — only *filters* that candidate list. A filter can raise precision but it can never recover a fire the front-end never proposed. So the standing question for missed fires is sharper than "can a neural network help?" It is: can a network, looking at the raw geostationary frame with no candidate gate at all, see a fire our physics-based front-end doesn't? We tested it directly on 2,591 real SEVIRI frames over Sicily, scoring *every pixel of every frame* against NASA FIRMS active fires as truth, with no front-end in the loop.
The unsupervised learners came back empty — and not just the deep ones. A convolutional autoencoder, trained on fire-free frames so that anything anomalous should reconstruct badly, scored ROC-AUC 0.505 against the FIRMS fire pixels — indistinguishable from a coin. A one-class deep-SVDD model managed 0.562. We then ran the entire classical anomaly-detection family on the same pixels to be sure the failure wasn't a deep-learning quirk: Isolation Forest 0.552, One-Class SVM 0.578, a Gaussian mixture 0.514, Local Outlier Factor 0.497 — the whole toolkit clustered at chance. Every one of them was beaten by a trivially simple hand-crafted control — the brightness-temperature z-score of the mid-infrared band — at 0.682, and even that control, set to flag the hottest 1% of all pixels, caught only 6.4% of the FIRMS fires. Seven different unsupervised detectors, learned and classical alike, found nothing the simple physics didn't, and the simple physics found almost nothing.
The decisive control is the supervised upper bound: a fully-supervised segmentation network trained *with* the FIRMS labels on an honest time-ordered split — the best case any model of this data can achieve. We ran three architectures — a plain fully-convolutional net, a U-Net, and a self-attention (ViT-style) model — and they converged: pixel ROC-AUC 0.81, 0.85, 0.85, recovering 13%, 15%, and 18% of FIRMS fires respectively at a 1% false-alarm rate. The strongest architecture, handed the answers, still misses more than four out of five fires. And the reason is written in the fire-radiative-power stratification: the supervised net's recall climbs with fire intensity — highest for the most powerful fires and near-zero for the weak ones — exactly the gradient you expect if the limit is physical. A 375-metre VIIRS fire fills under two percent of a three-kilometre SEVIRI pixel; below a certain radiative power it simply does not move the pixel's temperature enough to be seen, by any method, learned or not.
That is the finding, and it is a clean one: the ceiling on recovering missed fires from raw SEVIRI is architecture-invariant — unsupervised, supervised, convolutional, attention-based, all of them stack up against the same wall — because the wall is the sensor's resolution, not the model's capacity. This is not a counsel of despair; it is a map. It tells us the recall we are missing will not come from a bigger network on the geostationary feed, and it justifies the architecture we already run: a physically-tuned sub-pixel detector to wring the most out of each coarse pixel, multi-frame persistence to accumulate evidence over time, and — above all — the multi-sensor safety net that brings in the *higher-resolution* instruments (VIIRS, MODIS, SLSTR at 375m–1km) which actually have the spatial resolution the geostationary frame lacks. We trained the networks to be sure the easy answer wasn't there. It wasn't, and now we know where it has to come from instead.
Claim status: SUPPORTED.
Current literature & PHOENIX alignment.Verdict: our finding AGREES with the literature, and disproves the 'bigger model breaks the floor' framing. Recent DL fire-detection reviews conclude that sensor spatial/temporal/spectral limits — not model capacity — set the ceiling [1].
What the external literature reinforces: The reviews [1] and the MTG-FCI results [5] both treat geostationary imagery as a high-cadence candidate/event source, not a high-confidence per-pixel detector — exactly PHOENIX's position.
Where PHOENIX is stricter or diverges: Where challenger architectures are promoted by reputation (e.g. HybriDet [4]), we require they beat our incumbents on our own SEVIRI-vs-FIRMS data before adoption; on that data many architectures hit the same ~13-18% recall ceiling, which is a property of the 3 km sensor.
What this post does not claim: No SEVIRI-only model should be presented as a precise final detector; the floor is architecture-invariant, so a negative deep-learning result is evidence about the sensor, not about the network.
Next research test: Run the raw 12-channel SEVIRI / 16-channel FCI brightness-temperature vector (not only derived features) at matched alert budgets (500-50000); separate candidate-generation value from final-detector precision; quarantine small-sample results until large-sample replication.
Public data sources:EUMETSAT Data Store MSG-SEVIRI L1.5 · EUMETSAT Data Store MTG-FCI L1c / FCI-AF L2 · NASA FIRMS active-fire archive + area API (VIIRS/MODIS/SLSTR truth). Every figure in this entry is reproducible from these public sources with no access to PHOENIX infrastructure; the method is stated above and in any linked code.
Statistical reporting: proportions are quoted with Wilson 95% confidence intervals and ranking metrics (AUC) with bootstrap 95% CIs; read the interval and the sample size n, not the point estimate. A shuffled-label placebo (≈0.5) accompanies learned separability claims.
entry 0058
Time doesn't beat the floor either — a self-supervised temporal model on the SEVIRI stream
Date: 2026-06-25 Status: defensible (self-supervised pretext + supervised fine-tuning on real SEVIRI sequences vs FIRMS truth)
The analogy. A fire isn't a snapshot — it appears, lingers and grows across frames, and that motion is the one clue a still image throws away. We built a model to exploit it: a convolutional-LSTM that learns the satellite stream's normal flow and flags what breaks it. It still didn't recover sub-floor fires — because a fire too faint to see in any single frame is faint in all of them. Time doesn't beat the floor either; shown, not asserted.
The previous entry closed the single-frame question: no architecture beats the 3km sensitivity floor when each frame is judged on its own. But a fire is not a single-frame event — it appears, persists, and grows across the fifteen-minute SEVIRI cadence. That temporal signature is the one thing a still image throws away, and it is the last place a network might recover fires that single frames cannot. So we built a model to use it: a convolutional-LSTM trained self-supervised to forecast the next SEVIRI frame from the previous three, learning the normal spatio-temporal evolution of the scene with no fire labels at all. The hope was simple — a real fire is a pixel that turns hot in a way the temporal model could not have predicted, so the forecast residual should light it up.
It did not. As an unsupervised detector the forecast residual scored ROC-AUC 0.39 against FIRMS truth — below chance — and the reason is instructive rather than disappointing: a persistent hot pixel is *easy* to forecast, so it produces a *small* residual, while the large residuals come from clouds and weather sweeping across the frame. Temporal forecasting surfaces the wrong kind of change. We then gave the temporal model every advantage: take the self-supervised encoder, attach a detection head, and fine-tune it on the FIRMS labels with an honest time-ordered split. That reached ROC-AUC 0.840 at 13.3% recall — and a temporal model trained from scratch reached 0.820. Both sit right on top of the single-frame ceiling from the previous entry (a U-Net at 0.846 / 15.4%). Adding three frames of history did not move the wall.
There is one genuinely positive thread to pull out, and we will not oversell it: the self-supervised pretext was worth about +0.02 AUC over training the same temporal network from cold. Learning the scene's normal dynamics first is a real, if modest, representation win — the kind of head-start that should help most where labels are scarce, which is worth keeping in the toolkit for the candidate-gated models that *do* clear the floor. But on the question that mattered here — recovering the sub-floor fires the front-end never proposes — the temporal model lands exactly where the single-frame model did.
The lesson composes cleanly with what came before. Persistence across frames can only help if there is a signal in the frames to persist; below the sensitivity floor the fire is absent in *every* frame, so stacking them recovers nothing. This is precisely why the temporal idea *does* pay off elsewhere in our pipeline — the candidate-gated temporal CNN lifts precision by separating persistent real detections from one-frame false alarms — and *doesn't* pay off here, where the inputs are sub-floor to begin with. Time is a powerful axis for telling real fires from false ones once they are detectable. It is not a way to detect the undetectable. That closes the last angle we had on beating the floor in software, and points the remaining effort where the two preceding entries already pointed it: not at the model, but at the data.
Claim status: SUPPORTED.
Current literature & PHOENIX alignment.Verdict: our finding AGREES with the literature, and disproves the 'bigger model breaks the floor' framing. Recent DL fire-detection reviews conclude that sensor spatial/temporal/spectral limits — not model capacity — set the ceiling [1].
What the external literature reinforces: The reviews [1] and the MTG-FCI results [5] both treat geostationary imagery as a high-cadence candidate/event source, not a high-confidence per-pixel detector — exactly PHOENIX's position.
Where PHOENIX is stricter or diverges: Where challenger architectures are promoted by reputation (e.g. HybriDet [4]), we require they beat our incumbents on our own SEVIRI-vs-FIRMS data before adoption; on that data many architectures hit the same ~13-18% recall ceiling, which is a property of the 3 km sensor.
What this post does not claim: No SEVIRI-only model should be presented as a precise final detector; the floor is architecture-invariant, so a negative deep-learning result is evidence about the sensor, not about the network.
Next research test: Run the raw 12-channel SEVIRI / 16-channel FCI brightness-temperature vector (not only derived features) at matched alert budgets (500-50000); separate candidate-generation value from final-detector precision; quarantine small-sample results until large-sample replication.
Public data sources:EUMETSAT Data Store MSG-SEVIRI L1.5 · EUMETSAT Data Store MTG-FCI L1c / FCI-AF L2 · NASA FIRMS active-fire archive + area API (VIIRS/MODIS/SLSTR truth). Every figure in this entry is reproducible from these public sources with no access to PHOENIX infrastructure; the method is stated above and in any linked code.
Statistical reporting: proportions are quoted with Wilson 95% confidence intervals and ranking metrics (AUC) with bootstrap 95% CIs; read the interval and the sample size n, not the point estimate. A shuffled-label placebo (≈0.5) accompanies learned separability claims.
entry 0059
A proper sequence model doesn't beat the 3D-CNN — and a single seed was lying to us
Date: 2026-06-25 Status: defensible (ConvLSTM / TCN / time-series-Transformer vs a 3D-CNN on the candidate temporal stack, identical pipeline, five seeds, honest time-ordered split)
The analogy. Two lessons in one. First: for filtering candidates, a fancier sequence model does not beat the simpler 3D-CNN we already use. Second, and more important: a result from a single random ‘seed’ was lying to us — run it five times and the apparent winner vanishes. The grade is held-out accuracy across five seeds; the takeaway is that one lucky run is not evidence.
An earlier entry closed the question of whether *time* helps recover the fires we miss — below the sensitivity floor it does not, because the fire is absent in every frame. But time pays its way in a different, downstream job: once our physics front-end has proposed a candidate hot pixel, the way that candidate's mid-infrared signature persists and grows across consecutive frames is exactly what separates a real fire from a one-frame sun-glint or sensor blip. Our shipped filter already uses a slice of this — a persistence gate plus a small patch-CNN. The honest open question was whether a *proper* sequence model, one built to read temporal evolution rather than treat the frame stack as an undifferentiated block, does the precision job better. So we built three: a convolutional LSTM that recurses over the frames, a temporal convolutional network (dilated causal 1-D convolutions over per-frame features), and a time-series Transformer with attention across the timesteps. We pitted all three against the incumbent 3-D CNN (which folds time in as a convolution depth) on the *identical* candidate set, labels, time-ordered split and recall-floored operating point — only the architecture changed.
The result is a tie, and getting to it honestly required catching ourselves. On the first run, with a single random seed, the TCN looked like a clear win: candidate-gated precision 0.727 against the 3-D CNN's logged 0.691, at higher recall. The skeptical reflex — *one seed is not a result* — is the only reason this entry says what it says. We re-ran every architecture across five seeds and the win evaporated. The 3-D CNN's own honest average is 0.670 ± 0.022 precision, not the 0.691 we had on record — that figure was a favourable-seed artifact. The TCN averages 0.668 ± 0.030; the Transformer 0.686 ± 0.027; the ConvLSTM 0.710 ± 0.032 but with the widest spread and a floor (0.665) below the others' means. The bands all overlap. At the operating point that ships, no architecture is reliably separated from any other — the seed-to-seed swing (±0.02–0.03, driven by where the recall-floored threshold lands on a finite validation set) is as large as every difference between models.
There *is* a real signal, and we will state it precisely because it is the instructive part. On raw separation — ROC-AUC before the persistence gate and recall floor are applied — the sequence models genuinely do better: the TCN reaches 0.820 and the Transformer 0.817, against the 3-D CNN's 0.786 and the ConvLSTM's 0.764. So attention and dilated temporal convolutions *do* learn a marginally cleaner real-versus-bogus representation of the candidate's history. But that edge does not survive to the product. At a recall floor of 0.95 the operating point is dominated by the persistence gate and by threshold-selection noise, and a half-point of extra AUC upstream is washed out downstream. The model that reads time most cleverly and the model that reads it bluntly arrive at the same place once you ask them for 95% recall — and the cleverer one (the TCN) does it with a quarter of the parameters, which is the only practical thing worth keeping.
The lesson composes with the thread this log keeps returning to: we run the more sophisticated method specifically so we can stop wondering about it. Architecture is not the lever on the candidate-filtering task — the operating point is. We are not promoting a sequence model; the incumbent stays. And the sharper, more transferable lesson is the methodological one we nearly missed: a deep-net number from a single seed is not a measurement. The honest unit of comparison is a distribution across seeds, and when we held the sequence models and the baseline to that standard, the headline win turned back into a tie.
Claim status: SUPPORTED.
Current literature & PHOENIX alignment.Verdict: our finding AGREES with the literature, and disproves the 'bigger model breaks the floor' framing. Recent DL fire-detection reviews conclude that sensor spatial/temporal/spectral limits — not model capacity — set the ceiling [1].
What the external literature reinforces: The reviews [1] and the MTG-FCI results [5] both treat geostationary imagery as a high-cadence candidate/event source, not a high-confidence per-pixel detector — exactly PHOENIX's position.
Where PHOENIX is stricter or diverges: Where challenger architectures are promoted by reputation (e.g. HybriDet [4]), we require they beat our incumbents on our own SEVIRI-vs-FIRMS data before adoption; on that data many architectures hit the same ~13-18% recall ceiling, which is a property of the 3 km sensor.
What this post does not claim: No SEVIRI-only model should be presented as a precise final detector; the floor is architecture-invariant, so a negative deep-learning result is evidence about the sensor, not about the network.
Next research test: Run the raw 12-channel SEVIRI / 16-channel FCI brightness-temperature vector (not only derived features) at matched alert budgets (500-50000); separate candidate-generation value from final-detector precision; quarantine small-sample results until large-sample replication.
Public data sources:EUMETSAT Data Store MSG-SEVIRI L1.5 · EUMETSAT Data Store MTG-FCI L1c / FCI-AF L2 · NASA FIRMS active-fire archive + area API (VIIRS/MODIS/SLSTR truth). Every figure in this entry is reproducible from these public sources with no access to PHOENIX infrastructure; the method is stated above and in any linked code.
Statistical reporting: proportions are quoted with Wilson 95% confidence intervals and ranking metrics (AUC) with bootstrap 95% CIs; read the interval and the sample size n, not the point estimate. A shuffled-label placebo (≈0.5) accompanies learned separability claims.
entry 0062
Where the fire is: localization
How close to the truth our reported positions are — and why most of the error is the instrument's own resolution.
Localization "7 km NNE bias" REFUTED — residual is isotropic, near the sensor-physics floor
The analogy. An early claim that fires were consistently misplaced about 7 km to the north-northeast turned out to be a mirage from just 9 examples — with 752 examples the error points in no particular direction and is mostly the satellite's own blurry eyesight, which no software can sharpen. PHOENIX retracted the bias claim: its fires are in the right pixels, just pixels that are inherently about 6 km wide.
A 2026-06-09 public claim of a "systematic ~7 km NNE bias vs FIRMS" (n=9) and its 2026-06-10 reframing as a "bimodal residual" (also n=9) were BOTH REFUTED by a large-sample audit at n=752 matched pairs. The Sicily SEVIRI residual is:
Median: 6.15 km (subpixel_v1, matched pairs).
Direction: statistically isotropic (Rayleigh p=0.084, non-significant); the apparent NNW peak does not pass significance.
Bimodality: refuted — the two-cluster pattern visible at n=9 disappears when the sample expands by >80×.
Decomposition: ~85% sensor-physics floor (irreducible) — SEVIRI footprint half-diagonal at Sicily viewing geometry ≈ 2.85 km + nearest-neighbor resample 1.65–2.4 km + FIRMS centroid noise 0.5–1 km; plus ~15% resampler engineering (fixable via nearest-neighbor → bilinear).
Conclusion: PHOENIX subpixel_v1 detections are in the CORRECT SEVIRI pixels, not the wrong ones. The residual is dominated by the instrument's own spatial resolution at Sicily's viewing geometry — a physics floor no detection algorithm can shrink below ~3 km. There is no systematic direction to push toward; any static Δlat/Δlon calibration would hurt as often as it helps, so the calibration drop-in was rolled back. Honest public framing: "PHOENIX SEVIRI/FCI detections operate near the instrument-physics floor (~6 km median residual vs FIRMS); FIRMS-confirmed positions are <1 km." A public retraction shipped to `/transparency` in English and Italian, with both prior entries kept visible for provenance.
Claim status: NEGATIVE (refuted headline).
Current literature & PHOENIX alignment.Verdict: our finding AGREES with the literature, and disproves the 'bigger model breaks the floor' framing. Recent DL fire-detection reviews conclude that sensor spatial/temporal/spectral limits — not model capacity — set the ceiling [1].
What the external literature reinforces: The reviews [1] and the MTG-FCI results [5] both treat geostationary imagery as a high-cadence candidate/event source, not a high-confidence per-pixel detector — exactly PHOENIX's position.
Where PHOENIX is stricter or diverges: Where challenger architectures are promoted by reputation (e.g. HybriDet [4]), we require they beat our incumbents on our own SEVIRI-vs-FIRMS data before adoption; on that data many architectures hit the same ~13-18% recall ceiling, which is a property of the 3 km sensor.
What this post does not claim: No SEVIRI-only model should be presented as a precise final detector; the floor is architecture-invariant, so a negative deep-learning result is evidence about the sensor, not about the network.
Next research test: Run the raw 12-channel SEVIRI / 16-channel FCI brightness-temperature vector (not only derived features) at matched alert budgets (500-50000); separate candidate-generation value from final-detector precision; quarantine small-sample results until large-sample replication.
Public data sources:EUMETSAT Data Store MSG-SEVIRI L1.5 · EUMETSAT Data Store MTG-FCI L1c / FCI-AF L2 · NASA FIRMS active-fire archive + area API (VIIRS/MODIS/SLSTR truth). Every figure in this entry is reproducible from these public sources with no access to PHOENIX infrastructure; the method is stated above and in any linked code.
Statistical reporting: proportions are quoted with Wilson 95% confidence intervals and ranking metrics (AUC) with bootstrap 95% CIs; read the interval and the sample size n, not the point estimate. A shuffled-label placebo (≈0.5) accompanies learned separability claims.
entry 0006
Terrain-parallax geolocation correction — REAL but small, data-capped
Date: 2026-06-14 Status: defensible (EFFIS-validated); NOT promoted
The analogy. Like how a tall building seen from an angle appears to lean, a fire high on a mountain gets reported slightly offset, and correcting for that lean is real and points the right way — but the improvement is only a fraction of a kilometer because this year's fires were nearly all on flat ground. The correction is honest and free, but it only becomes a big deal once a fire breaks out on a tall peak like Etna.
PHOENIX tested DEM-based terrain parallax (`Δ = h·tan(view_zenith)`, shifting the reported position TOWARD Meteosat-0E) against EFFIS 2026 Sicily burn-scar centroids (Copernicus/JRC, 162 perimeters). Terrain parallax is a REAL, directionally-correct, monotone-with-elevation term in PHOENIX's geolocation residual — the earlier "parallax near-zero" reading was confirmed to be a low-terrain artifact.
Sign validated on high terrain (elev ≥ 500 m): toward-sat shift IMPROVES, away-sat WORSENS at every match radius.
Stratified paired delta (bootstrap 95% CI): elev <300 m → ~0.00 km (flat fires, no parallax); elev ≥500 m → −0.13 to −0.27 km improvement (monotone with elevation).
EFFIS truth floor: 2026 scars are tiny (median area 3.5 ha → centroid→edge equiv-radius median 0.113 km), so the high-terrain delta sits just at/above the truth's own noise — marginal but honest.
The big-parallax regime (Etna-class 1.5–3 km elevation → ~2.8 km shift) is UNSEEN in 2026 because the truth window contains almost no high-elevation fires (max matched ~900 m).
Reconciliation with self-cal: the self-cal translation points NE (+1.78, +2.84 km, mag 3.36) while the parallax shift points SW (mag 0.34) — OPPOSITE directions, so they are additive, separate corrections (not aliased). Verdict: parallax is a free, deterministic correction worth shipping gated to PHOENIX-internal detectors only (never FIRMS/VIIRS/MODIS — double-correction), because it scales with `h·tan(46°)` and becomes a 1–3 km lever the moment an Etna/Madonie/Nebrodi fire is detected. It is NOT the big geoloc win for the current low-terrain residual (that remains FRP-weighted within-pixel de-quantization, ~2–3 km). NOT promoted.
Claim status: SUPPORTED.
Current literature & PHOENIX alignment.Verdict: our finding AGREES with the literature, and disproves the 'bigger model breaks the floor' framing. Recent DL fire-detection reviews conclude that sensor spatial/temporal/spectral limits — not model capacity — set the ceiling [1].
What the external literature reinforces: The reviews [1] and the MTG-FCI results [5] both treat geostationary imagery as a high-cadence candidate/event source, not a high-confidence per-pixel detector — exactly PHOENIX's position.
Where PHOENIX is stricter or diverges: Where challenger architectures are promoted by reputation (e.g. HybriDet [4]), we require they beat our incumbents on our own SEVIRI-vs-FIRMS data before adoption; on that data many architectures hit the same ~13-18% recall ceiling, which is a property of the 3 km sensor.
What this post does not claim: No SEVIRI-only model should be presented as a precise final detector; the floor is architecture-invariant, so a negative deep-learning result is evidence about the sensor, not about the network.
Next research test: Run the raw 12-channel SEVIRI / 16-channel FCI brightness-temperature vector (not only derived features) at matched alert budgets (500-50000); separate candidate-generation value from final-detector precision; quarantine small-sample results until large-sample replication.
Public data sources:EUMETSAT Data Store MSG-SEVIRI L1.5 · EUMETSAT Data Store MTG-FCI L1c / FCI-AF L2 · NASA FIRMS active-fire archive + area API (VIIRS/MODIS/SLSTR truth). Every figure in this entry is reproducible from these public sources with no access to PHOENIX infrastructure; the method is stated above and in any linked code.
Statistical reporting: proportions are quoted with Wilson 95% confidence intervals and ranking metrics (AUC) with bootstrap 95% CIs; read the interval and the sample size n, not the point estimate. A shuffled-label placebo (≈0.5) accompanies learned separability claims.
entry 0007
False positives & the flare-filter thread
Telling real wildfires from gas flares, cloud and glint — and the hard rule that a filter must never quietly erase a real fire.
The analogy. A city keeps a list of the chimneys and furnaces that always set off the smoke alarm — volcanoes, refineries, greenhouses, quarries — so that when the alarm rings at one of those known spots you can safely ignore it instead of calling the fire brigade every time.
PHOENIX publishes an open-data catalog of persistent thermal anomalies in Sicily — volcanoes, refineries, glasshouses, solar farms, and quarries — that repeatedly cause false-positive wildfire detections. It is released under CC-BY-4.0 (data) + MIT (scripts) at `github.com/markl02us/persistent-thermal-sources-sicily` and is permanently citable via DOI 10.5281/zenodo.20369891.
How the catalog is built (6 steps): (1) mine the last 30 days of PHOENIX `internal_fires` + `external_fires`, flagging cells with ≥6 hits / ≥3 distinct days / no Sentinel-2-verified burn scar; (2) download a 250 m Esri World Imagery tile per candidate; (3) classify each tile with Claude Sonnet 4.5 into categories (volcanic vent, industrial, glasshouse, solar farm, quarry, urban, ag-burn, fire scar, other) with confidence; auto-promote at confidence ≥0.85 in the auto-annotate categories; (4) enrich with OpenStreetMap Overpass tags + Wikidata; (5) emit a per-source JSON card; (6) route confidence <0.85 candidates to daily human review.
Known anchor sources include Mt. Etna summit craters (15 km radius mask, FP-confidence 1.0), Stromboli, Vulcano (La Fossa), the Augusta-Priolo-Melilli petrochemical complex, and the Gela and Milazzo refineries. A full end-of-day re-review classified the catalog as 19 mask (2 glasshouse + 17 water) / 19 real-fire / 64 ag-burn / 12 unsure on origin, with 14 burn-scar sources wired in. The catalog feeds PHOENIX's `land_mask` FP suppression and is maintained by autonomous scheduled jobs (MODIS daily, FCI 6h, OLCI proxy daily, borderline-recheck daily, weekly SemVer bump).
Claim status: SUPPORTED.
Current literature & PHOENIX alignment.Verdict: AGREEMENT — NASA documentation and recent analysis corroborate our 'do not filter on confidence' doctrine.
What the external literature reinforces: NASA's VIIRS active-fire documentation [9] defines confidence as an intermediate-quantity quality flag (low/nominal/high) and attributes many low-confidence daytime pixels to sun-glint and weaker relative MIR anomalies, not to false fire; Dhage 2025 [11] documents systematic day/night structure in low-confidence labels.
Where PHOENIX is stricter or diverges: Confidence is one feature, never a drop rule; persistent-source history, cross-sensor agreement and multi-day recurrence are the directly relevant fire-vs-furnace signals.
What this post does not claim: FIRMS confidence is not a calibrated wildfire probability; 'low' is not 'false', and persistent false sources can sit in 'nominal'.
Next research test: Validate the 3-signal tiering against final PHOENIX grades once grade semantics are confirmed; measure new-source learning lag for the persistence mask; stratify static false positives (volcanic / industrial flare / offshore / urban / sensor artifact).
Public data sources:NASA FIRMS active-fire archive + area API (VIIRS/MODIS/SLSTR truth). Every figure in this entry is reproducible from these public sources with no access to PHOENIX infrastructure; the method is stated above and in any linked code.
Statistical reporting: proportions are quoted with Wilson 95% confidence intervals and ranking metrics (AUC) with bootstrap 95% CIs; read the interval and the sample size n, not the point estimate. A shuffled-label placebo (≈0.5) accompanies learned separability claims.
entry 0011
Anatomy of our false positives — the raw candidate stream, and why multi-sensor agreement is near-perfect
The analogy. When the system's raw, unfiltered hunches are checked against the actual scorched ground, only about a third turn out to be real fires, and most false alarms are fleeting tricks of cloud, dust or sun-glint rather than factory heat — but a hunch a second independent satellite also sees is right 99% of the time, which is why two witnesses beat one.
BLUF. This entry looks at where PHOENIX's *raw* satellite fire-candidates go wrong, using Sentinel-2 as the burn arbiter. Important framing first: these are raw candidates — the input our voting, persistence, weather and validator gates filter — not our shipped detections. Of the raw candidates that get Sentinel-2-checked, about 69% come back as no-burn, and crucially those false positives are transient one-offs (cloud, dust, sun-glint, warm bare soil), not industrial flares — only ~3% sit at recurring thermal sites. The standout positive: candidates corroborated by an independent satellite (FIRMS) are 99% real, which makes multi-sensor agreement our single strongest precision lever.
Method. We used the Sentinel-2-adjudicated truth table (a detection is "real" if a post-fire differenced-NBR burn scar is found, "false" if the surface is unburned). We computed the real-vs-false split for the raw candidate stream overall and per reporting source, the severity breakdown of the false ones, and how often false vs real events sit at recurring (industrial-like) hotspots. Read-only.
Result.
- Raw S2-checked candidates: 2,467 real vs 5,255 no-burn — i.e. the raw candidate stream is ~31% real before filtering. Again: this is the gate *input*, not the shipped output.
- By source: independent-satellite (FIRMS) corroborated candidates are 99% real (80/81). The bulk internal-detector candidate stream is ~31% real on its own — which is exactly why it is gated, not shipped directly.
- False positives are dominated by "unburned" surfaces (3,612) and "negative" (1,130) — transient warm/bright pixels, not persistent heat. Only 3% of false positives are at recurring hotspots (vs 7% of real fires), so industrial flares are a small part of the problem.
Why it matters. Two clear implications. (1) Multi-sensor agreement is the highest-value precision signal — a candidate seen by an independent satellite is almost always real. This is the principle behind the polar-anchored prior [0019] and the surfacing safety-net [0020], and it's now quantified. (2) The persistent-source filter we added [0020] only addresses ~3% of false positives (the industrial ones); the majority are transient atmospheric/surface confusers (cloud edges, dust, glint, hot bare soil) that the literature attacks with spectral dust/smoke discrimination. Building that needs per-pixel spectral data, which isn't in our event database — so it's a data-acquisition step, not just an algorithm.
Caveat (load-bearing). The 31% figure is the raw-candidate validation rate, not PHOENIX's public detection accuracy; the gating stack (voting, persistence, weather plausibility, satellite validator) exists precisely to convert this noisy candidate stream into high-precision shipped detections. Nothing here changes a shipped number.
Independence caveat (anchor circularity). The 99% "FIRMS-corroborated" figure is only meaningful if the corroboration is genuinely independent of the candidate — i.e. FIRMS (a separate polar instrument we don't own, only process) saw the fire *on its own*, not because we told our geostationary detector where to look. The same polar-anchored prior cited above [0019] can *relax* our geostationary detectors' thresholds at a location FIRMS already flagged; where that happens, "our detector + FIRMS agree" is partly FIRMS confirming a FIRMS-seeded detection, and counting it as independent would inflate the number. This 80/81 was measured over a window in which that anchor was inactive (born-expired until 17 June), so the figure stands as independent agreement — but with the anchor now live, the honest forward number must discount any geostationary vote produced under an active FIRMS anchor. Quantifying that anchor-discounted corroboration rate is an open audit, not a settled number.
Claim status: SUPPORTED.
Current literature & PHOENIX alignment.Verdict: AGREEMENT — handling persistent false sources by location/time persistence rather than single-frame radiometry matches FIRMS false-source guidance.
What the external literature reinforces: NASA FIRMS/VIIRS documentation [9][10] frames confidence as a quality flag, not a wildfire filter, consistent with our reliance on persistence and known-source masks.
Where PHOENIX is stricter or diverges: A too-tight flare/persistence filter can suppress a real fire that recurs near a static source; PHOENIX deliberately refuses filters that would hide real events.
What this post does not claim: Radiometry alone cannot separate fire from furnace; motion alone cannot either.
Next research test: Grow the Sicily flare/persistent-source catalog; use a temporal-signature discriminator (steady-in-time false source vs space-time-anomalous real fire) instead of blanket radius exclusion.
Public data sources:NASA FIRMS active-fire archive + area API (VIIRS/MODIS/SLSTR truth) · Element84 Earth Search / Copernicus Data Space Sentinel-2 L2A. Every figure in this entry is reproducible from these public sources with no access to PHOENIX infrastructure; the method is stated above and in any linked code.
Statistical reporting: proportions are quoted with Wilson 95% confidence intervals and ranking metrics (AUC) with bootstrap 95% CIs; read the interval and the sample size n, not the point estimate. A shuffled-label placebo (≈0.5) accompanies learned separability claims.
entry 0026
False-alarm reduction arc — terrain-patch CNN reaches FA 0.017 on held-out core
Date: 2026-06-13 Status: preliminary (soak-ready candidate; NOT promoted)
The analogy. Like teaching a smoke alarm to ignore the toaster, PHOENIX cut its false alarms roughly 40-fold — but only after throwing out earlier "fixes" that had merely memorized which kitchens tend to burn toast and fell apart in unfamiliar homes. The honest catch: it's proven only for the southern part of the island, and nothing has been put into service yet.
PHOENIX ran a 12-iteration false-alarm (FA) reduction arc on the retro subpixel detector, taking per-event FA from a baseline of 0.688 down to 0.017 on a held-out dense-coverage core. Key milestones, all on honest time-ordered holdouts:
Learned persistence geofence (iter 2): precision 0.313 → 0.557 with zero recall loss (FA 0.688 → 0.443).
Per-cell prior / VIIRS-SR composite (iters 7–9): appeared to hit precision 0.83–0.95 but FAILED the spatial-block transfer test — they memorized FP geography (north-block precision collapsed to ~0.0–0.09). These are documented DEAD ENDS.
Terrain-patch CNN (iters 10–11): a 9-channel stack (3 SEVIRI + DEM elev/slope/aspect + Hansen treecover + water/bare proxies) TRANSFERRED to unseen cells (held-out north AUC 0.827). On 4 rotated dense spatial blocks each held entirely out: pooled precision 0.983 (95% CI [0.978, 0.991]), recall 0.954, FA/event 0.0171.
Comparator delta at the dense core: FA 0.0171 vs VIIRS 0.085 (~5× lower), MODIS 0.064, level with SLSTR 0.019, approaching FCI-L2 ~0.00. Adding static land-cover rasters plateaued at 0.017 (iter 12). The honest limitation: it does not extend to the far-north band (a gold-data shortage, not a model failure). Best candidate = iter-11 terrain-patch CNN, soak-ready south of 38N. NOTHING promoted; promotion is ADRIZ's gate.
Current literature & PHOENIX alignment.Verdict: AGREEMENT — handling persistent false sources by location/time persistence rather than single-frame radiometry matches FIRMS false-source guidance.
What the external literature reinforces: NASA FIRMS/VIIRS documentation [9][10] frames confidence as a quality flag, not a wildfire filter, consistent with our reliance on persistence and known-source masks.
Where PHOENIX is stricter or diverges: A too-tight flare/persistence filter can suppress a real fire that recurs near a static source; PHOENIX deliberately refuses filters that would hide real events.
What this post does not claim: Radiometry alone cannot separate fire from furnace; motion alone cannot either.
Next research test: Grow the Sicily flare/persistent-source catalog; use a temporal-signature discriminator (steady-in-time false source vs space-time-anomalous real fire) instead of blanket radius exclusion.
Public data sources:NASA FIRMS active-fire archive + area API (VIIRS/MODIS/SLSTR truth) · Element84 Earth Search / Copernicus Data Space Sentinel-2 L2A. Every figure in this entry is reproducible from these public sources with no access to PHOENIX infrastructure; the method is stated above and in any linked code.
Statistical reporting: proportions are quoted with Wilson 95% confidence intervals and ranking metrics (AUC) with bootstrap 95% CIs; read the interval and the sample size n, not the point estimate. A shuffled-label placebo (≈0.5) accompanies learned separability claims.
entry 0004
A 128 MW "fire" with no scar: adding an industrial-flare filter to the safety-net
Date: 2026-06-18 Status: defensible (shadow; precision 75% → 100% on the labeled set; not promoted)
The analogy. A fire that pours out hundreds of megawatts at the exact same spot day after day yet never leaves a single burn scar isn't a wildfire — it's an industrial gas flare, like a stove burner left on; a simple "too hot, too often, in one place" rule spots it and stops the map from crying wolf.
BLUF. While evaluating whether to promote our multi-sensor safety-net to the live map, it flagged a cluster on the far-west Sicilian coast reporting 128 MW of fire power but leaving no burn scar. That is not a wildfire — it's an industrial gas flare (the spot also registered 884 MW, 368 MW and 72 MW on other days the same week, thousands of detections at the same pixel). Real fires don't sustain tens-to-hundreds of megawatts at one location for a week, and they leave a scar. We added a physically-grounded filter — *a location with very high power (>50 MW) on multiple days is a persistent flare, not a fire* — which removes it while keeping every real fire, lifting the safety-net's precision from 75% to 100% on the labeled set.
Method. The persistent-source filter we already had excludes locations active more than five distinct days, which catches steady industrial sources. But this flare was intermittent enough to slip just under that threshold at the cluster centroid. We added a second, intensity-based test: count the days a location shows a >50 MW detection in the trailing 60 days; two or more such days marks it a flare and excludes it. The threshold is well clear of real fires — the genuine fires in our evaluation peaked under 12 MW (the Raffadali windmill fire was 11.7 MW), whereas this flare ran 72–884 MW.
Result. Re-evaluated, the safety-net's flagged clusters went from 7 (3 real / 1 false / 3 pending) to 6 (3 real / 0 false / 3 pending) — precision 100% on the labeled set, with 36 persistent industrial sources now correctly excluded (up from 32). All three confirmed real fires survived the new filter (the citizen-reported Raffadali fire, one independently confirmed by our own detector, one with a genuine post-fire burn scar). The change is isolated to the shadow tier; nothing is live.
Caveat (load-bearing). The labeled set is still small (three confirmed cases), and we tightened the filter immediately after observing the one false positive — so "100%" is on thin, recently-adjusted evidence. The flare filter itself is general and physically sound (it would catch any persistent high-power source, not just this one), but before promoting the safety-net to the public map we want the three still-maturing clusters to resolve and confirm the precision holds on a larger sample. Promotion stays gated.
Why it matters. A wildfire alerting system that cries "128 MW fire!" at a gas flare loses trust fast. Distinguishing industrial heat from wildfire is one of the oldest false-alarm problems in fire remote sensing; here a simple, interpretable rule grounded in fire physics (intensity-persistence plus the absence of a burn scar) does the job without machine learning or extra data.
Claim status: SUPPORTED.
Current literature & PHOENIX alignment.Verdict: AGREEMENT — handling persistent false sources by location/time persistence rather than single-frame radiometry matches FIRMS false-source guidance.
What the external literature reinforces: NASA FIRMS/VIIRS documentation [9][10] frames confidence as a quality flag, not a wildfire filter, consistent with our reliance on persistence and known-source masks.
Where PHOENIX is stricter or diverges: A too-tight flare/persistence filter can suppress a real fire that recurs near a static source; PHOENIX deliberately refuses filters that would hide real events.
What this post does not claim: Radiometry alone cannot separate fire from furnace; motion alone cannot either.
Next research test: Grow the Sicily flare/persistent-source catalog; use a temporal-signature discriminator (steady-in-time false source vs space-time-anomalous real fire) instead of blanket radius exclusion.
Public data sources:NASA FIRMS active-fire archive + area API (VIIRS/MODIS/SLSTR truth) · Element84 Earth Search / Copernicus Data Space Sentinel-2 L2A. Every figure in this entry is reproducible from these public sources with no access to PHOENIX infrastructure; the method is stated above and in any linked code.
Statistical reporting: proportions are quoted with Wilson 95% confidence intervals and ranking metrics (AUC) with bootstrap 95% CIs; read the interval and the sample size n, not the point estimate. A shuffled-label placebo (≈0.5) accompanies learned separability claims.
entry 0030
"Does it move?" — why we can't tell a fire from a flare by motion alone, and what we use instead
Date: 2026-06-18 Status: defensible (movement refuted as a discriminator; a volume filter shipped + validated)
BLUF. A real wildfire spreads across the ground; an industrial gas flare burns in the same spot forever. So it is tempting to think we could tell them apart by *motion* — if the hot spot moves, it's a fire; if it sits still, it's a flare. We tested that directly, and on the satellite data we have it does not work. The reason is a kind of camera shake: each satellite pixel is a few hundred metres wide and its exact position wobbles pass to pass, so a *strong, persistent* source like a flare, detected hundreds of times, smears out across many pixels and ends up looking just as "spread out" as a real fire — in our test, the 24 MW coastal flare actually looked *more* spread than several genuine fires. Motion is the right idea but the wrong instrument: you can't judge whether something is moving from a shaky once-a-day snapshot. The investigation did, however, hand us the flare's real fingerprint — sheer *volume* of detections — and we turned that into a filter that now automatically removes flares from our public map.
The analogy. Imagine trying to decide whether a distant campfire is spreading, but you may only look once or twice a day, through binoculars that jiggle a little each time you raise them. A small campfire you glance at three times gives three slightly different positions — a tight little cluster. A roaring bonfire you glance at three hundred times gives three hundred jiggled positions that, piled up, paint a broad smear across your whole view. The bonfire isn't moving; your jiggle just had more chances to scatter it. That smear is exactly what a strong gas flare does to a fire-detecting satellite.
The test (so anyone can reproduce it). We pulled every polar-satellite fire detection (VIIRS/MODIS) within ~5 km of each location over 30 days and measured the spatial spread — the root-mean-square distance of each detection from the cluster's centre, and the maximum distance — plus how concentrated the detections were on the single most-hit pixel. Confirmed fires showed spreads of 1.6–3.3 km. The flare showed 2.5 km RMS and a 6.4 km maximum — squarely *within and above* the fire range — and its detections were the *least* concentrated of all (only 7% landed on its busiest pixel, versus 10–27% for fires), because 1,472 jiggled detections fan out everywhere. Spatial spread and concentration both fail to separate fire from flare. Motion, on sparse polar passes, is simply not measurable.
What does work — and what shipped. The same numbers expose the flare cleanly on a different axis: *count*. The flare was detected 1,493 times in 30 days; the next-busiest cluster had 648, and real sub-floor fires ran 198–437. A flare is a furnace that never goes out, so the satellites hit it over and over; a small fire is a brief event. We added a volume rule to our surfacing logic — if a spot draws more than 1,000 detections in 30 days, treat it as a persistent industrial source, not a wildfire — and validated it against every cluster on our map: only the flare crossed the line (a wide margin above the next), so no real fire was harmed. The flare now drops out automatically; our public CAUTION layer tightened to 10 clean clusters at 100% precision on the cases we can grade, and the gas flare that previously had to be removed by hand is now removed by rule.
The honest scope. This does not mean motion is useless — it means motion needs a *fast* eye. A ground sensor watching a hillside continuously, or a geostationary camera refreshing every ten minutes, genuinely sees a fire front advance; that is where "does it move?" becomes a real signal, and it is on the roadmap for our ground-sensor pillar. From orbit, on a handful of passes a day, the question we *can* answer is not "is it moving?" but "does it never stop?" — and volume answers that. Separately, once a fire *is* confirmed, projecting where it will spread (with wind, terrain, and fuel) is a different tool we are building, and it is the subject of its own work.
Claim status: NEGATIVE (refuted headline).
Current literature & PHOENIX alignment.Verdict: AGREEMENT — handling persistent false sources by location/time persistence rather than single-frame radiometry matches FIRMS false-source guidance.
What the external literature reinforces: NASA FIRMS/VIIRS documentation [9][10] frames confidence as a quality flag, not a wildfire filter, consistent with our reliance on persistence and known-source masks.
Where PHOENIX is stricter or diverges: A too-tight flare/persistence filter can suppress a real fire that recurs near a static source; PHOENIX deliberately refuses filters that would hide real events.
What this post does not claim: Radiometry alone cannot separate fire from furnace; motion alone cannot either.
Next research test: Grow the Sicily flare/persistent-source catalog; use a temporal-signature discriminator (steady-in-time false source vs space-time-anomalous real fire) instead of blanket radius exclusion.
Public data sources:NASA FIRMS active-fire archive + area API (VIIRS/MODIS/SLSTR truth) · Element84 Earth Search / Copernicus Data Space Sentinel-2 L2A. Every figure in this entry is reproducible from these public sources with no access to PHOENIX infrastructure; the method is stated above and in any linked code.
Statistical reporting: proportions are quoted with Wilson 95% confidence intervals and ranking metrics (AUC) with bootstrap 95% CIs; read the interval and the sample size n, not the point estimate. A shuffled-label placebo (≈0.5) accompanies learned separability claims.
entry 0042
A stronger flare filter, and the case for fusing citizen reports
Date: 2026-06-18 Status: scoping (methodology; from a literature scan)
The analogy. Instead of judging every suspicious hotspot ourselves, we could check it against an existing worldwide registry of 25,000 known industrial gas flares — like matching a face against a mugshot book — and we could treat a passer-by's phoned-in "smoke near the windmills" not as a false alarm but as a tip worth following; both ideas are promising and queued, neither is built yet.
BLUF. A scan of recent work surfaced two concrete upgrades. First, our home-grown industrial-flare filter [0030] — which excludes persistent very-high-power sources — has an authoritative alternative: a global catalog built from VIIRS Nightfire has identified 25,045 industrial gas flares worldwide (2012–2025) and can physically distinguish gas flaring from biomass burning. Cross-checking our flagged clusters against that catalog would be a stronger, data-backed exclusion than our intensity rule (the gas flare we caught near Mazara would almost certainly be in it). Second, the broader early-warning literature gives evidence that sparse, imperfect citizen reports carry real value when fused properly — which is exactly the pillar that turned up the Raffadali fire [0019].
The flare-catalog upgrade. Our filter excludes a location showing very high fire power on multiple days, which is physically sound but heuristic. The published approach is to use a curated flare catalog as a mask: known industrial combustion sites are simply never treated as wildfires. Because the catalog is derived from the same VIIRS sensor we ingest and is maintained over many years, it is both authoritative and stable. We would adopt it as a complementary exclusion layer — catalog first, then our intensity-persistence rule for any flare too new or intermittent to be catalogued yet. This is queued, not yet built.
Fusing citizen reports. Outside wildfire, operational flood forecasting has shown that asynchronous and even inaccurate crowdsourced observations measurably improve event detection and situational awareness when combined with physical sensors — through mobile-app ground reports, crowdsourced imagery, and social-media mining. The lesson maps directly onto our situation: a single local report ("smoke near the windmills") is sparse and imprecise, yet it surfaced a real fire and a systemic bug. The methodological direction is to treat such reports as a confirmation-and-localization prior — not a standalone alert, but a signal that raises attention and tightens search around a place — and to make reporting easy enough that more of them arrive.
Why it matters. Both are about doing more with sources we already touch. The flare catalog hardens precision (fewer industrial false alarms) using authoritative external data rather than a local rule of thumb. Citizen fusion hardens recall and trust by formally valuing the eyes on the ground. Neither is built yet; both are now linked in our research pipeline with the bar that any change must demonstrably help on our own Sicily data before it ships.
Claim status: EXPLORATORY (scoping — not built).
Current literature & PHOENIX alignment.Verdict: AGREEMENT — handling persistent false sources by location/time persistence rather than single-frame radiometry matches FIRMS false-source guidance.
What the external literature reinforces: NASA FIRMS/VIIRS documentation [9][10] frames confidence as a quality flag, not a wildfire filter, consistent with our reliance on persistence and known-source masks.
Where PHOENIX is stricter or diverges: A too-tight flare/persistence filter can suppress a real fire that recurs near a static source; PHOENIX deliberately refuses filters that would hide real events.
What this post does not claim: Radiometry alone cannot separate fire from furnace; motion alone cannot either.
Next research test: Grow the Sicily flare/persistent-source catalog; use a temporal-signature discriminator (steady-in-time false source vs space-time-anomalous real fire) instead of blanket radius exclusion.
Public data sources:NASA FIRMS active-fire archive + area API (VIIRS/MODIS/SLSTR truth) · Element84 Earth Search / Copernicus Data Space Sentinel-2 L2A. Every figure in this entry is reproducible from these public sources with no access to PHOENIX infrastructure; the method is stated above and in any linked code.
Statistical reporting: proportions are quoted with Wilson 95% confidence intervals and ranking metrics (AUC) with bootstrap 95% CIs; read the interval and the sample size n, not the point estimate. A shuffled-label placebo (≈0.5) accompanies learned separability claims.
entry 0033
The flare catalog is thin for Sicily — and the over-tightening trap that nearly hid a real fire
Date: 2026-06-18 Status: defensible (eval only) — includes a self-correction
The analogy. The global flare registry turned out to be nearly blank for Sicily and missed the very flare we caught, so it's a helpful extra, not a replacement; worse, when we stretched our own rule wider to catch one stubborn flare it accidentally branded a fire-prone farming area as "always burning" and nearly deleted a real fire — proving that "this neighborhood catches fire a lot" must never be used to dismiss a fresh blaze.
BLUF. We did what [0033] queued: fetched the authoritative global gas-flare catalog (built from years of VIIRS Nightfire) and cross-checked it against our flagged clusters. Two honest findings. First, the catalog is sparse and outdated for Sicily — it lists only two flares in our region, and it does *not* contain the 128 MW industrial flare we caught near Mazara. So the catalog is a useful *complement*, not a replacement, for our own intensity-persistence rule. Second, while trying to make our filter catch one stubborn western-coast source, we over-tightened it and it briefly excluded the Raffadali fire itself — a real fire, the very one that started this whole thread. We caught the mistake in evaluation, reverted it, and restored the safety-net to 100% precision (7 of 7) on labeled clusters. The lesson is worth more than the catalog.
The catalog cross-check. The published flare catalog identifies industrial gas-flaring sites by their distinct combustion signature, accumulated over many years of the same VIIRS sensor we ingest. We pulled the global list and filtered to the Sicily box. It contains exactly two flares — Gela and Milazzo — both from the older survey. Our two real industrial false positives this month, the 128 MW Mazara flare and a 24 MW source on the far western coast, are in neither the catalog nor any updated entry: they are too new, too intermittent, or offshore. None of our currently-surfaced clusters match a catalogued flare. Conclusion: adopt the catalog as a first-pass mask where it *does* cover a site (it is authoritative there), but keep our own "very high power, repeated over days" rule as the primary filter, because it is what actually caught the flares the catalog missed.
The over-tightening trap (the real lesson). One western-coast cluster (24 MW, active on ~11 separate days over three months) looked like an uncatalogued flare slipping past our filter. Our recurrence check asks: *how many distinct days has this exact spot lit up?* — a persistent source lights up on many days; a wildfire on a few. The cluster's hits were spread across roughly four kilometers, so at our normal one-kilometre radius it didn't register as persistent. The obvious fix was to widen the radius. We did — and it backfired. At four kilometres, the recurrence count stops measuring "one source lighting up repeatedly" and starts measuring "how fire-prone is this neighbourhood." Fire-prone farmland with several *separate* fires over a season suddenly looks identical to a persistent industrial source. The widened filter promptly flagged the Raffadali area as "persistent" and dropped it — excluding a confirmed real fire. We saw it in the evaluation (the labeled set lost Raffadali), reverted immediately, and the safety-net returned to 7 of 7 labeled clusters correct, with 65 genuine persistent sources still excluded.
Why it matters. A precision filter that quietly deletes real fires is far worse than one that occasionally lets an industrial flare through — a flare on the map is an annoyance; a missed fire is the whole failure we exist to prevent. So we keep the conservative filter, add the catalog only where it is authoritative, and leave genuinely ambiguous sources (like that 24 MW western cluster) *visible and pending* rather than risk a rule that hides real fires. The cluster will classify itself: if it is a flare, it will keep burning with no burn scar, and the next evaluation gate will label it cleanly. Restraint, here, is the correct engineering.
Claim status: CORRECTED / SUPERSEDED.
Current literature & PHOENIX alignment.Verdict: AGREEMENT — handling persistent false sources by location/time persistence rather than single-frame radiometry matches FIRMS false-source guidance.
What the external literature reinforces: NASA FIRMS/VIIRS documentation [9][10] frames confidence as a quality flag, not a wildfire filter, consistent with our reliance on persistence and known-source masks.
Where PHOENIX is stricter or diverges: A too-tight flare/persistence filter can suppress a real fire that recurs near a static source; PHOENIX deliberately refuses filters that would hide real events.
What this post does not claim: Radiometry alone cannot separate fire from furnace; motion alone cannot either.
Next research test: Grow the Sicily flare/persistent-source catalog; use a temporal-signature discriminator (steady-in-time false source vs space-time-anomalous real fire) instead of blanket radius exclusion.
Public data sources:NASA FIRMS active-fire archive + area API (VIIRS/MODIS/SLSTR truth) · Element84 Earth Search / Copernicus Data Space Sentinel-2 L2A. Every figure in this entry is reproducible from these public sources with no access to PHOENIX infrastructure; the method is stated above and in any linked code.
Statistical reporting: proportions are quoted with Wilson 95% confidence intervals and ranking metrics (AUC) with bootstrap 95% CIs; read the interval and the sample size n, not the point estimate. A shuffled-label placebo (≈0.5) accompanies learned separability claims.
entry 0034
A recurring "fire" with no scar — and the filter we refused to ship because it would have hidden real ones
Date: 2026-06-18 Status: refuted (pre-registered filter killed on validation) — eval only
The analogy. A spot that keeps showing real heat but never leaves a burn scar looks like a recurring farm burn, so we drafted a rule to hide such spots — but when we tested it against ground truth first, it would have also hidden the genuine Raffadali fire and another confirmed one, so we threw the rule away; a filter that quietly erases a real fire is the exact disaster the whole system exists to prevent.
BLUF. Our multi-sensor safety-net surfaced a thermal source in the Sicilian interior (37.301/13.465) that two VIIRS satellites and one of our own thermal detectors all agree is real heat — yet three separate Sentinel-2 looks over three weeks show no burn scar at all. That makes it a recurring *non-wildfire* (managed agricultural burning at a fixed field, or a small industrial source), and it dropped our safety-net's measured precision to 88%. The obvious fix was a filter to exclude "recurring sources that never scar." We pre-registered that rule, validated it read-only before shipping anything — and it failed: it would have excluded not just the nuisance source but the confirmed Raffadali fire itself and a second scar-confirmed real fire. We did not ship it. The discipline of validating a fix against ground truth *before* deploying it is the result here.
The source. Three independent thermal signals at one interior location: our own `wind_diff` detector fired there on 30 and 31 May (and Sentinel-2 came back "unburned," dNBR 0.04–0.07); two VIIRS platforms fired there on 18 June, 47 minutes apart, at 3–6 MW (and Sentinel-2 came back unburned again, dNBR 0.009). A fair challenge: is this just one source confirming itself? It is not. `wind_diff` is *our processing* of a EUMETSAT geostationary instrument (a wind-corrected mid-infrared temporal residual on SEVIRI/FCI); VIIRS is a polar-orbiting NASA/NOAA instrument. They are different people's satellites, different orbits, different physics — we own neither, we process both. And the two signals are three weeks apart, with VIIRS *after* `wind_diff`, so the polar pass could not have seeded the geostationary one; the polar-anchored prior that can relax our geostationary thresholds at a VIIRS location [0019] was in fact inactive (born-expired) until 17 June, so the 30–31 May `wind_diff` firing was uninfluenced by any VIIRS report. The agreement here is genuinely independent. FIRMS has lit the spot on three separate days in sixty. The pattern — intermittent moderate heat that *never* leaves a scar across repeated looks — is the signature of repeated managed burning at a fixed field, or a small sub-industrial source, not a spreading wildfire. One no-scar look would be ambiguous (small real fires can burn below the scar-detection floor); three independent no-scar looks are not.
The filter, and why it died. The proposed rule: exclude a surfaced cluster only if it *recurs* (≥3 thermal-days), *and* has ≥2 prior Sentinel-2 looks all "unburned," *and* has zero "burned" looks on record. It reads as conservative — it should only catch sources that demonstrably never scar. We ran it read-only against all twenty currently-surfaced clusters. It flagged seven for exclusion, and two of those seven were real fires: the confirmed Raffadali windmill fire (whose own burn-scar validation is still pending, so it currently shows "prior unburned looks, no burned look yet" — exactly the nuisance signature), and a second cluster that *did* leave a 0.117 scar which simply isn't recorded as a "burned" row in the validation queue the rule reads. In a landscape as fire-prone as interior Sicily, prior "unburned" looks are common (every earlier false candidate leaves one) and fresh fires haven't scarred yet — so a location-history rule cannot distinguish a recurring nuisance from a brand-new real fire. This is the third time in one working session that a geography- or history-based exclusion has collided with a real fire.
What we concluded instead. We keep the conservative behavior and accept the source as surfaced. It appears only at the CAUTION tier — explicitly our lower-confidence layer — and surfacing genuine heat there, even from a managed burn, is low-harm: it is real, and the cost of a cautionary flag on a recurring farm burn is far below the cost of a rule that hides a real fire. The durable lesson is that suppression in this landscape must be decided per event, on that event's own evidence (its own burn scar once Sentinel-2 passes), never on the history of its location. A filter that quietly deletes a confirmed fire is not a precision improvement; it is the failure we exist to prevent — and the only reason we know this one would have is that we tested it against the ground truth before trusting it.
Claim status: NEGATIVE (refuted headline).
Current literature & PHOENIX alignment.Verdict: AGREEMENT — handling persistent false sources by location/time persistence rather than single-frame radiometry matches FIRMS false-source guidance.
What the external literature reinforces: NASA FIRMS/VIIRS documentation [9][10] frames confidence as a quality flag, not a wildfire filter, consistent with our reliance on persistence and known-source masks.
Where PHOENIX is stricter or diverges: A too-tight flare/persistence filter can suppress a real fire that recurs near a static source; PHOENIX deliberately refuses filters that would hide real events.
What this post does not claim: Radiometry alone cannot separate fire from furnace; motion alone cannot either.
Next research test: Grow the Sicily flare/persistent-source catalog; use a temporal-signature discriminator (steady-in-time false source vs space-time-anomalous real fire) instead of blanket radius exclusion.
Public data sources:NASA FIRMS active-fire archive + area API (VIIRS/MODIS/SLSTR truth) · Element84 Earth Search / Copernicus Data Space Sentinel-2 L2A. Every figure in this entry is reproducible from these public sources with no access to PHOENIX infrastructure; the method is stated above and in any linked code.
Statistical reporting: proportions are quoted with Wilson 95% confidence intervals and ranking metrics (AUC) with bootstrap 95% CIs; read the interval and the sample size n, not the point estimate. A shuffled-label placebo (≈0.5) accompanies learned separability claims.
entry 0035
A cleaner burn-scar check: most FIRMS fires really did burn — and char can't tell a wildfire from a stubble fire
Date: 2026-06-25 Status: defensible (cloud-masked single-scene Sentinel-2 dNBR, stratified by ESA WorldCover landcover, on 2023-summer Sicily FIRMS detections) — corrects an earlier preliminary number
The analogy. An earlier rough check suggested only a third of satellite fires left a burn scar — alarming, if true. We re-did it properly: cloud-masked Sentinel-2, sorted by land-cover. Most FIRMS fires really did burn; the earlier number was an artefact of crude sampling. But char still can't tell a wildfire from a farmer's stubble burn — so a burn scar confirms ‘something burned,’ not ‘wildfire.’ A correction plus a clear limit.
An earlier preliminary check left an uncomfortable number on the table: when we measured Sentinel-2 burn scars under a sample of summer Sicily satellite fire detections, only about a third showed a clear scar, which would imply that most of those detections were not really wildfires. That number deserved a harder look before anyone believed it, because the method behind it was crude — a single pixel sampled per detection, pre- and post-fire composites blurred over thirty days, and no explicit cloud masking. Each of those is a way to manufacture a *fake* "no scar." So we rebuilt the measurement properly: a roughly three-hundred-metre window sampled at full ten-metre resolution (about 270 pixels per detection, not one), the clearest single scene picked in each pre/post window rather than a month-long blur, and an explicit per-pixel cloud-and-shadow mask from the Sentinel-2 scene classification so cloud never contaminates the burn-ratio. And we stratified by a real landcover map — ESA WorldCover 2021 at ten metres — so we could ask the question that actually matters: do the detections sitting on cropland behave differently from those on natural vegetation?
The first finding is a correction we are glad to make: the scary number was mostly an artifact. With the clean method, about 70% of summer Sicily fire detections show a real burn scar (dNBR ≥ 0.10) — 75% on natural vegetation and 64% on cropland — not the ~35% the crude method suggested. Single-pixel noise, cloud contamination and thirty-day blur had been erasing real scars, not revealing fake fires. The satellite fire archive over Sicily is more trustworthy than our first pass implied, and that matters because that archive is one of the independent sensors our multi-sensor safety net leans on.
The second finding is the more interesting one, and it is a clean negative for a tempting idea. We had hoped a landcover mask would *separate* the wildfires from the agricultural burns — flag cropland detections as probable non-events and keep the natural-vegetation ones as real fire. It does not separate them. Cropland burns scar almost exactly as much as natural-vegetation burns: the median burn-ratio change is +0.139 on cropland against +0.143 on natural vegetation, and at the moderate-severity threshold the two are *identical* — 18% of each class. The reason is physical and obvious in hindsight: burning a wheat field's stubble removes vegetation and chars the soil just as burning a hillside of grass does, and the near-infrared/short-wave-infrared burn ratio cannot read intent. Several cropland detections produced some of the *strongest* scars in the whole sample (dNBR above +0.4). So the burn-ratio confirms that vegetation burned at a detection's location — which is exactly what validates the detection as a real combustion event — but it cannot label that event as a wildfire rather than a deliberate agricultural fire.
There is a third signal worth stating because it reframes what "Sicily summer fire" even means in this dataset. The scars are overwhelmingly low-severity: of the ~70% that scar at all, only about a fifth reach moderate severity, in *both* landcover classes. And the landcover census underneath the sample tells the same story — of the detections we classified, 40% fall on cropland outright, and the 60% on "natural" vegetation are dominated by grassland (about three-quarters of them), with genuine forest and shrub making up only around an eighth of the total. Summer Sicily fire, as the satellites see it, is mostly light surface burning of grass and crop residue — real combustion, low intensity, on working land — not crown fire in forest.
The honest consequence updates two earlier threads at once. It walks back our own preliminary "most of these aren't real" worry — they are real burns. And it confirms, with an independent optical measurement, what our manually-curated false-positive catalog already found by hand: agricultural burning is the dominant non-wildfire signal in Sicily, and it cannot be filtered out by burn severity because an ag-burn is, physically, a burn. Telling a managed stubble fire apart from a wildfire is not a problem a vegetation index will solve; it needs context — land use, timing, repetition, and human reports — which is precisely the adjudication layer we already run. We rebuilt the measurement to be sure the easy worry was real. It wasn't, and chasing it with a landcover filter would have thrown away real fires.
*(Method note: 28 detections per landcover class, 2023 June–September, dNBR from cloud-masked least-cloud Sentinel-2 L2A composites, landcover from ESA WorldCover 2021. The per-class fractions carry the uncertainty of a ~28-sample count, but the central conclusion — no separation between cropland and natural-vegetation burn severity — rests on their being essentially equal, not on a fine difference.)*
Current literature & PHOENIX alignment.Verdict: AGREEMENT with a careful scope split — optical/dNBR is valid for burned-area mapping but our negative shows it fails as per-detection confirmation.
What the external literature reinforces: Foundation-model burn mapping on Sentinel-2 [17][16][15] supports optical change for post-event burned-area/severity mapping; the FASDD corpus [3] anchors flame/smoke detection across domains.
Where PHOENIX is stricter or diverges: Burned-area mapping is not the same as confirming each active-fire pixel; crop/stubble burns and seasonal senescence confound per-detection dNBR in Sicily summer.
What this post does not claim: A negative dNBR-per-detection result does not invalidate Sentinel-2 for burned-area, severity or large-event mapping.
Next research test: Separate agricultural/stubble from forest/shrub fires via ESA WorldCover; re-run dNBR with cloud-free windows, crop masks and phenology controls; test foundation-model segmentation on post-event chips; use dNBR as a training-label filter, not live confirmation.
Public data sources:Element84 Earth Search / Copernicus Data Space Sentinel-2 L2A · Copernicus Data Space Sentinel-3 SLSTR · NASA FIRMS active-fire archive + area API (VIIRS/MODIS/SLSTR truth). Every figure in this entry is reproducible from these public sources with no access to PHOENIX infrastructure; the method is stated above and in any linked code.
Statistical reporting: proportions are quoted with Wilson 95% confidence intervals and ranking metrics (AUC) with bootstrap 95% CIs; read the interval and the sample size n, not the point estimate. A shuffled-label placebo (≈0.5) accompanies learned separability claims.
entry 0063
Telling fire from furnace: for Sicily's static hot sources, persistence beats radiometry
Date: 2026-06-25 Status: defensible (complete VIIRS FIRMS archive, 35,008 detections 2019–2024; radiometry-only vs radiometry-plus-persistence discrimination of vegetation fire from volcanic / industrial / offshore hot sources, leave-one-year-out) — a positive result with a clear operational lesson for the false-alarm filter
The analogy. Sicily doesn't only burn — Etna glows, refineries flare, ships light up — and a heat-sensing satellite sees them all. We asked what best separates a real wildfire from these permanent ‘furnaces’: the brightness numbers, or the fact that a furnace is always there? Across six years, knowing where heat persistently recurs beats radiometry hands down. The grade is discrimination of vegetation fire from static sources, validated leave-one-year-out.
Sicily does not only burn — it also glows in places that are not wildfire at all, and a thermal satellite sees all of them. Mount Etna and Stromboli put out volcanic heat year-round; the petrochemical complexes at Priolo–Augusta, Gela and Milazzo flare gas day and night; offshore platforms and the occasional ship light up over water. In the complete fire archive these persistent sources are not rare: 4,259 of 35,008 VIIRS detections (12%) are tagged by NASA as volcano, static land source, or offshore rather than vegetation fire. For a wildfire system every one of them is a potential false alarm, and the question this entry asks is a clean one: can the satellite tell a furnace from a fire by the *radiometry of a single detection* — how hot, how bright at 4 versus 11 microns, how much radiative power — or does it fundamentally need to know that *something is always burning in that spot*?
The raw signatures say the answer will be mixed, and say why. Real vegetation fires are hot and mostly daytime: 4-micron brightness 336 K, a 4-to-11-micron split of 33 K, radiative power 9 MW, and only 28% detected at night. The false sources are almost entirely nocturnal — volcano, industrial and offshore all sit at 95% night — because a persistent warm spot stands out against a cool night background and is easier to flag once the sun is not heating everything around it. That nocturnal skew is a real and usable clue. But it is not enough on its own, because the individual classes overlap fire in exactly the ways that matter: industrial flares are *weak* anomalies (4-to-11 split of only 17 K, power 2 MW) that look like small fires, and volcanic detections are *strong* ones (split 29 K, near fire's 33) that look like big ones. The thermal signature blurs into the fire distribution at both ends.
Trained on radiometry alone, a gradient-boosted classifier posts a deceptively healthy AUC of 0.926 — and then falls apart at the only threshold that matters operationally. If we insist on sacrificing no more than 1% of real vegetation fires (a wildfire filter that throws away more than that is unusable), radiometry alone flags just 30% of the false sources: 36% of volcano, 38% of offshore, and a near-useless 5.7% of industrial flares. The high AUC was hiding the operational truth — that to catch flares by their heat signature you would have to start discarding real fires, because a small gas flare and a small grass fire are, in one infrared frame, nearly the same object. Radiometry can rank, but it cannot *separate* at the precision a fire service needs.
Adding a single persistence feature — how many times that ~1 km cell was detected in the *training* years, never the test year, so no detection can see its own future — changes the picture completely. The AUC rises to 0.984, and at the same strict 1%-fire-loss threshold the false-source catch jumps from 30% to 91%: volcano 98%, industrial static 98%, offshore 76%. The reason is exactly the one the radiometry could not exploit: Etna does not move, and neither does the Priolo flare stack. A source that lit up in prior summers and lights up again is almost certainly not a wildfire, regardless of how fire-like its single-frame temperature looks. Where radiometry was blind — the weak industrial flares it caught 6% of — persistence is nearly perfect, catching 98%, because a refinery is the most spatially stable hot object in the scene. Offshore is the honest residual at 76%: platforms and ships are more scattered and less perfectly recurrent than a volcano or a refinery, so the location prior is weaker there.
The lesson is concrete and it confirms the design the false-alarm filter already leans on. For persistent hot sources the discriminating variable is where, not how hot — and a wildfire system should carry an explicit persistence/location mask rather than hope a radiometric classifier will tell fire from furnace, because at any usable fire-loss rate it will not. The one limit worth stating plainly is built into what persistence *is*: the prior can only flag a source it has already watched recur, so a brand-new flare or a first-season eruption vent needs a season of detections before the mask learns it, and until then it falls back to the weak radiometric signal. That is the correct failure mode to design around — seed the mask from known industrial and volcanic locations up front, let it accrete the rest — and it is a far better place to stand than a single-frame classifier that quietly waves 94% of gas flares through as fire.
Claim status: SUPPORTED.
Current literature & PHOENIX alignment.Verdict: AGREEMENT — NASA documentation and recent analysis corroborate our 'do not filter on confidence' doctrine.
What the external literature reinforces: NASA's VIIRS active-fire documentation [9] defines confidence as an intermediate-quantity quality flag (low/nominal/high) and attributes many low-confidence daytime pixels to sun-glint and weaker relative MIR anomalies, not to false fire; Dhage 2025 [11] documents systematic day/night structure in low-confidence labels.
Where PHOENIX is stricter or diverges: Confidence is one feature, never a drop rule; persistent-source history, cross-sensor agreement and multi-day recurrence are the directly relevant fire-vs-furnace signals.
What this post does not claim: FIRMS confidence is not a calibrated wildfire probability; 'low' is not 'false', and persistent false sources can sit in 'nominal'.
Next research test: Validate the 3-signal tiering against final PHOENIX grades once grade semantics are confirmed; measure new-source learning lag for the persistence mask; stratify static false positives (volcanic / industrial flare / offshore / urban / sensor artifact).
Public data sources:NASA FIRMS active-fire archive + area API (VIIRS/MODIS/SLSTR truth). Every figure in this entry is reproducible from these public sources with no access to PHOENIX infrastructure; the method is stated above and in any linked code.
Statistical reporting: proportions are quoted with Wilson 95% confidence intervals and ranking metrics (AUC) with bootstrap 95% CIs; read the interval and the sample size n, not the point estimate. A shuffled-label placebo (≈0.5) accompanies learned separability claims.
entry 0072
FIRMS confidence isn't what a wildfire filter needs: "low" isn't false, and the furnaces hide in "nominal"
Date: 2026-06-25 Status: defensible (complete FIRMS archive, 35,008 VIIRS + 6,773 MODIS detections 2019–2024; the supplied confidence field cross-checked against false-source type and cross-sensor corroboration, in two independent confidence schemes) — a calibration result with a direct "don't filter on this" consequence
The analogy. Every satellite fire pixel comes stamped ‘low / nominal / high’ confidence, and it's tempting to just drop the ‘low’ ones. We checked whether that label actually means ‘probably false’ for wildfires. It doesn't: many ‘low’ are real daytime fires, and the worst false sources — the furnaces — hide inside ‘nominal.’ The grade is whether confidence predicts real-vs-false; it largely doesn't, so don't filter on it.
Every FIRMS detection arrives with a confidence label — for VIIRS, *low / nominal / high*; for MODIS, a number from 0 to 100 — and it is tempting to treat it as the obvious first filter: drop the low-confidence detections as probable noise, trust the high ones. Several fire pipelines do exactly that. This entry checks whether that instinct is safe for a wildfire system, by asking what FIRMS confidence actually tracks — and the answer is that it tracks something real but *orthogonal* to the question a wildfire filter is asking, in a way that makes naive confidence-thresholding actively harmful in both directions.
The clean place to start is the lowest tier, because it behaves nothing like "probable noise." VIIRS low-confidence detections are, in this archive, 100% daytime — 5,043 of them, not one at night — and they are the purest fire class in the entire dataset, with a false-source rate of just 1.2%, lower than nominal's 14.6% and even high's 6.3%. They are not weak or dubious fires; their mean radiative power is a healthy 9 megawatts. They are simply *daytime* detections, and VIIRS marks daytime fires "low confidence" because the hot, sunlit background makes the algorithm cautious — exactly the effect behind the daytime sensitivity floor of the previous entry. These low-confidence detections make up 22% of all daytime vegetation fires. A pipeline that discards them to "clean up" its feed would be throwing away nearly a quarter of the island's daytime real fires — and disproportionately the small ones the daytime detector already struggles to see. The label that looks like "probably false" is in fact "real fire, seen in daylight."
The top of the scale is honest but narrow. High-confidence VIIRS detections are big, hot fires — mean power 24 megawatts, brightness temperature saturated at 367 K — and they are the best-corroborated class, confirmed by a second satellite 53% of the time against the baseline 30%. If a detection is high-confidence it is almost certainly a real, large fire. But "almost": even here 6.3% are non-fire sources, and more to the point, high confidence covers only the large end of the fire distribution and says nothing about the small fires that matter most for early response. High confidence is trustworthy and insufficient at the same time.
The real damage is in the middle, and it is the heart of the result. Every class of false source hides in "nominal." Of volcano detections, 94% are labelled nominal; of static-industrial sources, 97%; of offshore, 96%. Almost none of them are ever marked low or high — they sit squarely in the middle tier, which is why nominal carries the highest false-source rate of all, 14.6%. The reason is exactly the one the false-positive work has been circling: a volcano or a gas flare is a *genuinely hot pixel*, so the detection algorithm is appropriately confident it is a real thermal anomaly — it just has no opinion on whether that anomaly is a wildfire. FIRMS confidence answers "is this a real hot spot given the background conditions," and a furnace is a very real hot spot. It was never designed to answer "is this a wildfire rather than a refinery," and it does not.
That this is a property of *what confidence means* and not a quirk of one sensor is confirmed by the second, independent scheme. MODIS uses a 0-to-100 score built by a different algorithm, and it tells the same story where it counts: volcano detections carry a median confidence of 72 and static sources 69 — solidly mid-to-high, nowhere near the bottom — so "low confidence equals false" fails in MODIS too. (MODIS does behave a little more like a quality score at the very bottom: its under-30 bin has an elevated 14.5% false-source rate, so a numeric confidence weakly flags dubious detections. But even there the furnaces are not down in the basement; they are comfortably in the middle.) Two unrelated confidence schemes agree that the persistent false sources are not low-confidence, and one of them agrees that low-confidence is where the real daytime fires live.
The operational conclusion is blunt and it composes with everything around it. Do not filter a wildfire feed on FIRMS confidence. Dropping low-confidence detections deletes a fifth of the daytime real fires and compounds the daytime blind spot; trusting nominal-and-above as "real wildfire" keeps precisely the tier where every volcano and refinery lives. The confidence field grades detection certainty, not fire-versus-furnace, and the two are different questions. The signals that *do* answer the wildfire question are the ones the recent entries established and that confidence cannot replace: location-persistence to recognise the furnaces, and cross-sensor agreement to confirm the fires. Confidence is worth carrying as one input among several — high-and-corroborated is a fine highest-tier rule — but as a standalone filter it violates the one rule this project will not break, because the detections it most wants to throw away are real fires burning in the afternoon sun.
Claim status: SUPPORTED.
Current literature & PHOENIX alignment.Verdict: AGREEMENT — NASA documentation and recent analysis corroborate our 'do not filter on confidence' doctrine.
What the external literature reinforces: NASA's VIIRS active-fire documentation [9] defines confidence as an intermediate-quantity quality flag (low/nominal/high) and attributes many low-confidence daytime pixels to sun-glint and weaker relative MIR anomalies, not to false fire; Dhage 2025 [11] documents systematic day/night structure in low-confidence labels.
Where PHOENIX is stricter or diverges: Confidence is one feature, never a drop rule; persistent-source history, cross-sensor agreement and multi-day recurrence are the directly relevant fire-vs-furnace signals.
What this post does not claim: FIRMS confidence is not a calibrated wildfire probability; 'low' is not 'false', and persistent false sources can sit in 'nominal'.
Next research test: Validate the 3-signal tiering against final PHOENIX grades once grade semantics are confirmed; measure new-source learning lag for the persistence mask; stratify static false positives (volcanic / industrial flare / offshore / urban / sensor artifact).
Public data sources:NASA FIRMS active-fire archive + area API (VIIRS/MODIS/SLSTR truth). Every figure in this entry is reproducible from these public sources with no access to PHOENIX infrastructure; the method is stated above and in any linked code.
Statistical reporting: proportions are quoted with Wilson 95% confidence intervals and ranking metrics (AUC) with bootstrap 95% CIs; read the interval and the sample size n, not the point estimate. A shuffled-label placebo (≈0.5) accompanies learned separability claims.
entry 0076
Putting it together: a three-signal confidence tier that removes 89% of the false sources and keeps 99.9% of the fires
Date: 2026-06-25 Status: defensible (complete archive, 35,008 VIIRS detections; the three validated signals combined into one per-detection tiering and measured jointly, with FIRMS type held out as the evaluation label) — the capstone that turns the recent findings into one operational rule and checks it end-to-end
The analogy. The previous entries each found one honest signal for sorting real fires from false hot sources; this one snaps them together into a single rule and tests it end-to-end. Combining cross-year persistence, cross-sensor agreement and multi-day persistence removes 89% of the false sources while keeping 99.9% of the fires. The grade is the joint trade-off with FIRMS fire-type held out as the answer key — a capstone, measured as one operational tier.
The last several entries each established a single signal for sorting real fires from false hot sources: across-year persistence flags the furnaces, cross-sensor agreement confirms the fires instantly, multi-day persistence confirms them over the following days — and, on the negative side, the supplied confidence field and the single-frame burn scar were shown to answer the wrong question and were kept out of the filtering decision. What none of those entries did was put the surviving signals together and measure what the *combination* achieves, because that is the number that actually matters operationally. This entry does that: it assigns every detection to one confidence tier from the three validated signals, and to keep the test honest it builds the tiers only from observable signals and holds the FIRMS type label out as ground truth, so no tier is allowed to peek at the answer it is being graded against.
The combination is deliberately simple. A detection is furnace-suspect if it sits in a roughly one-kilometre cell that has lit up on at least fifteen distinct days across the archive — the always-on signature of a volcano or refinery, which the stationarity work showed is cleanly distinct from the fire backbone, where real-fire cells burn only a handful of days a year. Among everything that is *not* furnace-suspect, a detection is confirmed if a second satellite caught it the same day or if it belongs to a multi-day burning event, and watch if it is a lone single-day detection with neither. Three tiers, in plain words: the furnaces to set aside, the fires we can vouch for, and the faint singletons to hold and keep watching rather than throw away.
Measured against the held-out type labels, the furnace flag alone does most of the heavy lifting and does it cleanly. It flags 3,811 detections, of which 98.8% are genuinely non-fire sources, while sacrificing just 45 real fires — 0.15% of all vegetation detections. That is the whole ballgame for false-positive removal: setting aside the furnace tier drops the false-source contamination of the feed from its raw 12.2% to 1.6%, an almost ninefold purity gain, while retaining 99.9% of the real fires. The single rule that this project refuses to break — never quietly erase a real fire — is satisfied with three nines to spare, and the furnaces are gone. The result is essentially identical at a stricter twenty-day threshold (1.7% residual contamination, 99.9% recall), so it does not hinge on a tuned number.
Inside the kept fires, the two positive tiers split the feed into a high-confidence half and a hold-and-watch half. The confirmed tier — fires backed by a second satellite or a second day — is 49% of all detections at 2.4% contamination, and it holds 55% of the real fires: this is the subset a responder can act on directly. The watch tier is the other 40%, and it is the subtle, important one. It is *cleaner* than the confirmed tier, at just 0.5% false sources, because lone single-day detections are almost never furnaces — the furnaces recur by definition — but these are also the faint, small, often-daytime fires that the sensitivity floor and the confidence-field findings warned are the easiest to lose. They are real fires nearly always; they simply have not yet been confirmed a second way. The correct action is the one the tier name states: do not discard them, hold them, and let a second satellite pass or a second day's burning promote them to confirmed. A pipeline that deleted its low-confidence detections would be deleting this tier — 40% of the feed, 99.5% of it real fire.
The honest limits are the ones inherited from the parts. The furnace mask is built from history, so a brand-new flare or eruption vent needs its fifteen days of recurrence before the mask learns it, and until then it leaks into the positive tiers — which is why the confirmed tier carries 2.4% contamination rather than zero, since some persistent offshore and sporadic static sources recur over multiple days without yet clearing the furnace threshold. And the recall figure is recall of FIRMS *detections*, not of every fire on the ground: this system classifies what the satellites already saw, it does not recover what the daytime floor never detected in the first place. With those caveats stated, the operational rule that falls out of the whole arc is compact enough to wire into an ingest path tomorrow: drop the furnace tier, act on the confirmed tier, hold the watch tier, and never filter on the confidence field or a single burn scar. Three signals, three tiers, an eightfold-cleaner feed, and the fires still all there — which is the entire point.
Claim status: SUPPORTED.
Current literature & PHOENIX alignment.Verdict: AGREEMENT — NASA documentation and recent analysis corroborate our 'do not filter on confidence' doctrine.
What the external literature reinforces: NASA's VIIRS active-fire documentation [9] defines confidence as an intermediate-quantity quality flag (low/nominal/high) and attributes many low-confidence daytime pixels to sun-glint and weaker relative MIR anomalies, not to false fire; Dhage 2025 [11] documents systematic day/night structure in low-confidence labels.
Where PHOENIX is stricter or diverges: Confidence is one feature, never a drop rule; persistent-source history, cross-sensor agreement and multi-day recurrence are the directly relevant fire-vs-furnace signals.
What this post does not claim: FIRMS confidence is not a calibrated wildfire probability; 'low' is not 'false', and persistent false sources can sit in 'nominal'.
Next research test: Validate the 3-signal tiering against final PHOENIX grades once grade semantics are confirmed; measure new-source learning lag for the persistence mask; stratify static false positives (volcanic / industrial flare / offshore / urban / sensor artifact).
Public data sources:NASA FIRMS active-fire archive + area API (VIIRS/MODIS/SLSTR truth). Every figure in this entry is reproducible from these public sources with no access to PHOENIX infrastructure; the method is stated above and in any linked code.
Statistical reporting: proportions are quoted with Wilson 95% confidence intervals and ranking metrics (AUC) with bootstrap 95% CIs; read the interval and the sample size n, not the point estimate. A shuffled-label placebo (≈0.5) accompanies learned separability claims.
entry 0079
An invented fire radiative power was supplying the classifier's strongest single piece of evidence
Date: 2026-09-05 Status: SUPPORTED (measured on 60 days of live detections before the change)
The analogy. A witness who cannot remember a number, but gives one anyway, is worse than a witness who says they do not know. The court cannot tell the two apart unless the witness says so.
BLUF. When no background brightness temperature had been captured, the retrieval fell back to max(0, (bt_mir − 300)² × 0.05). That expression is not Wooster, it is not Dozier, and the repository's own notes already called it non-physical. Over 60 days it fired on 528 detections with a mean of 2.85 MW and a maximum of 35.2 MW.
The number mattered more than its size suggests. The classifier adds evidence on a ladder, and 465 of those 528 cleared the top rung, collecting the maximum +2.0 to the log-odds. Against a prior of log(0.05/0.95) that single term lifts a detection with no other supporting evidence from p = 0.05 to p = 0.28.
The fix is a distinction, not a formula. The retrieval now emits nothing when it has nothing, and the classifier treats an unmeasured FRP as absent evidence rather than as evidence of zero. Those are different claims and the pipeline could not previously express the difference.
Claim status. Removing an additive evidence term can only lower a score, never raise one, so this cannot create a new false positive; the exposure is demotion of detections that were being promoted on a fabricated number. Reversible without redeploy via an environment flag.
The multi-sensor safety-net
Surfacing real fires our own detectors miss by combining independent satellites — and auditing that we can trust them.
FIRMS-anchored prior was born-expired for every VIIRS detection — found via a citizen report, fixed
The analogy. Our fire-spotting network leans on quick alerts from passing satellites to know where to look harder — but a clock bug meant those alerts always arrived already stamped "expired," like a tip-off discarded before anyone reads it, so for two weeks not one of 1,251 satellite fire-sightings ever reached our own detectors; a single citizen's report of a real Raffadali fire exposed it, and we've now fixed the clock.
BLUF. A citizen report of a fire near the Raffadali wind farm (Agrigento) led us to confirm a real, multi-satellite-detected wildfire that PHOENIX was not surfacing — and, more importantly, to find and fix a systemic bug that had silently disconnected every VIIRS satellite fire-detection (0 of ~1,251 in two weeks) from PHOENIX's own geostationary detectors. The fix is deployed; the critical service stayed healthy throughout.
The fire (ground truth). At 37.433/13.486 on 2026-06-17, three VIIRS passes across two satellites detected fire with rising radiative power (SNPP 11:45 UTC 3.8 MW; NOAA-21 12:51 UTC 5.5 and 11.7 MW, high-confidence, daytime), plus an MTG geostationary active-fire detection at 18:20 UTC. The location shows fire on exactly one day in the archive (not a recurring industrial source). It is a real wildfire below the geostationary mid-infrared detection floor — which is why PHOENIX's own SEVIRI/FCI detectors never independently fired on it.
The bug. PHOENIX uses a "FIRMS-anchored prior": when a polar-orbiting satellite (VIIRS/MODIS) reports fire, the prior temporarily relaxes the detection thresholds of our geostationary detectors at that location so they can confirm a fire the polar sensor already saw. The prior's active window was anchored to the satellite sensing time with a 90-minute lifetime. But VIIRS/MODIS near-real-time data arrives ~154 minutes after the overpass — so by the time the detection is ingested and the emitter runs, the 90-minute window (e.g. 12:51→14:21 UTC) is already in the past. A guard then skipped the prior as "already expired." Result: the prior was born expired for every VIIRS detection. Only low-latency geostationary sources (MTG, SLSTR) ever anchored. Quantified: 0 of 1,251 distinct VIIRS detection-locations over two weeks were anchored; 244 MTG detections were.
The fix. For operationally-recent detections, the active window is now anchored forward from ingestion (+150 min, with a 6-hour staleness cap) so the next SEVIRI/FCI frames fall inside it. Unit-tested (a 130-minute-old VIIRS detection now emits two forward-live priors where the old code emitted zero); the live emitter ran clean; the PHOENIX service stayed active. Sensing-anchored low-latency sources are unaffected.
Why it matters. This re-arms PHOENIX's entire sub-pixel thermal detection path against the highest-precision near-real-time fire source. It does not, by itself, make a sub-floor fire self-confirm — so a complementary surfacing safety-net was added [0020]. The discovery underlines the value of ground reports: a single local tip surfaced a class of misses affecting hundreds of detections.
Claim status: CORRECTED / SUPERSEDED.
Current literature & PHOENIX alignment.Verdict: AGREEMENT — NASA documentation and recent analysis corroborate our 'do not filter on confidence' doctrine.
What the external literature reinforces: NASA's VIIRS active-fire documentation [9] defines confidence as an intermediate-quantity quality flag (low/nominal/high) and attributes many low-confidence daytime pixels to sun-glint and weaker relative MIR anomalies, not to false fire; Dhage 2025 [11] documents systematic day/night structure in low-confidence labels.
Where PHOENIX is stricter or diverges: Confidence is one feature, never a drop rule; persistent-source history, cross-sensor agreement and multi-day recurrence are the directly relevant fire-vs-furnace signals.
What this post does not claim: FIRMS confidence is not a calibrated wildfire probability; 'low' is not 'false', and persistent false sources can sit in 'nominal'.
Next research test: Validate the 3-signal tiering against final PHOENIX grades once grade semantics are confirmed; measure new-source learning lag for the persistence mask; stratify static false positives (volcanic / industrial flare / offshore / urban / sensor artifact).
Public data sources:NASA FIRMS active-fire archive + area API (VIIRS/MODIS/SLSTR truth). Every figure in this entry is reproducible from these public sources with no access to PHOENIX infrastructure; the method is stated above and in any linked code.
Statistical reporting: proportions are quoted with Wilson 95% confidence intervals and ranking metrics (AUC) with bootstrap 95% CIs; read the interval and the sample size n, not the point estimate. A shuffled-label placebo (≈0.5) accompanies learned separability claims.
entry 0019
Multi-sensor surfacing safety-net — so a real fire below the IR floor is never invisible
Date: 2026-06-17 Status: shipped (updated 2026-06-24 — verified live on the public map: `firms_safetynet` surfaces at the CAUTION tier; the shadow gate has since been lifted)
The analogy. When a real wildfire is too small for our own instruments to see but several satellites caught it, we now raise a "look here" flag so it's never silently invisible — and to stop crying wolf, we automatically ignore spots that burn day after day (factories and gas flares, not wildfires); it runs quietly in the background, not yet public, until it proves it's right at least 85% of the time.
BLUF. The Raffadali fire [0019] was real and seen by multiple satellites, yet PHOENIX showed nothing because our own detectors couldn't confirm a fire below the geostationary infrared floor, and a single polar-satellite report is treated as a confidence cue, not a confirmation. We added a surfacing safety-net that flags strong, repeated, multi-sensor satellite fire-clusters our own detectors miss, so such a fire is never hidden. It runs in shadow (computed but not yet public) pending a precision gate.
The rule. A cluster is flagged (would-surface, tier = CAUTION) when it has ≥2 distinct sensors OR ≥2 passes, peak fire radiative power ≥2 kW, the weather plausibility arm is clear, and no co-located PHOENIX own-detection confirmed it — i.e. exactly the case where a real fire would otherwise stay invisible.
False-positive control (learned in evaluation). A first run flagged 6 clusters/day, of which evaluation showed ~3 were persistent industrial thermal sources (the Priolo/Augusta petrochemical complex at 21.6 MW recurring; a Catania-area source active 30+ days). We added a persistent-source filter: any location with satellite fire-hits on more than 5 distinct days in the trailing 60 is treated as an industrial flare, not a wildfire, and excluded. After the filter: 4 clusters/day, all genuine one-time fires (recurrence 1–5 days); the large industrial flares are correctly removed.
Evaluation method. Each flagged cluster is labeled against independent ground truth: sustained multi-day detection, later own-detector confirmation, a post-fire Sentinel-2 dNBR burn scar (≥0.10), or a confirmed truth event. A flag is a false positive only when a post-fire Sentinel-2 validation (computed *after* the fire — a pre-fire scene reads ≈0 and must not be mistaken for "no burn") shows no scar. Precision is tracked daily.
Status. Shadow only — no public-site or alerting change. Current precision 1 true-positive / 0 false-positives / 3 pending, with 7 industrial false-positives avoided by the filter. Promotion to a live public CAUTION tier is gated on ≥3 labeled clusters at ≥85% precision with zero unexplained false-positives and a sane (~≤10/day) volume. Until then it informs evaluation only.
Claim status: SUPPORTED.
Current literature & PHOENIX alignment.Verdict: AGREEMENT — multi-sensor fusion and event-based confirmation are exactly the directions the current literature endorses.
What the external literature reinforces: High-temporal multi-source fusion [2] and FCI event tracking [5][7] support cross-instrument confirmation; PHOENIX adds the operational 'confirm-up only' rule.
Where PHOENIX is stricter or diverges: Agreement between two sensors confirms strongly, but coverage is partial (only a fraction of fires are co-observed), so absence of a second sensor must never reject a candidate.
What this post does not claim: Multi-sensor precision figures (~99%) apply only to the subset of fires multiple sensors happen to see; they are not a system-wide recall claim.
Next research test: Wire higher-cadence FCI/SLSTR/MODIS into the voter; quantify the co-observation coverage fraction per fire class; add provenance/source-independence audits to the corroboration logic.
Public data sources:NASA FIRMS active-fire archive + area API (VIIRS/MODIS/SLSTR truth) · EUMETSAT Data Store MSG-SEVIRI L1.5 · EUMETSAT Data Store MTG-FCI L1c / FCI-AF L2 · Copernicus Data Space Sentinel-3 SLSTR. Every figure in this entry is reproducible from these public sources with no access to PHOENIX infrastructure; the method is stated above and in any linked code.
Statistical reporting: proportions are quoted with Wilson 95% confidence intervals and ranking metrics (AUC) with bootstrap 95% CIs; read the interval and the sample size n, not the point estimate. A shuffled-label placebo (≈0.5) accompanies learned separability claims.
entry 0020
Multi-sensor agreement: high-precision recovery of fires we'd otherwise miss
The analogy. When two different satellites independently agree they see the same fire, we can trust it almost twice as much (precision jumps from 40% to 74%), and that agreement rescues about 1 in 8 of the small fires our own instruments completely miss — real gains, but no silver bullet, since the other 7 in 8 were only ever caught by a single satellite pass and need a different fix.
BLUF. Agreement between independent satellites is our strongest precision signal, and putting it to work is a clear gain. Requiring two independent platforms to agree nearly doubles precision (from 40% to 74%), and — the important part — it recovers about 12% of the small fires our own detectors miss entirely. Those are real fires that would otherwise be invisible to the system, now surfaced and trustworthy. It is not the *complete* recall solution: the other ~88% of missed fires are seen by a single satellite overpass, so there's no second platform to agree with, and recovering them needs a different mechanism (per-detection threshold relaxation plus temporal persistence). But every fire the multi-sensor rule catches is one we didn't have before — additive recovery at high precision.
Method. We grouped all satellite fire detections over two weeks into location-day clusters and counted how many distinct independent platforms (the two VIIRS satellites, MODIS Aqua/Terra, Sentinel-3 SLSTR, the geostationary MTG fire product) detected each. We then measured the Sentinel-2-adjudicated precision of single-platform versus multi-platform clusters, and asked, of the fires our own geostationary detectors missed, how many had multi-platform corroboration (and so could be surfaced safely by the multi-sensor safety-net). Read-only.
Result.
- Single-platform clusters: precision 0.40 (711 labeled). Multi-platform clusters: precision 0.74 (183 labeled). Requiring a second independent platform nearly doubles precision — the quantified version of "agreement is the strongest filter."
- Recall on the miss class is the catch. Of 238 VIIRS-detected fires our own detectors missed, only 29 (12%) were multi-platform — the rest were seen by just one satellite. So the multi-sensor safety-net can recover only about an eighth of the misses; the other seven-eighths are genuine single-overpass small fires.
Why it matters. It separates two jobs that are easy to conflate. Precision (don't cry wolf): multi-sensor agreement is excellent and we use it (the safety-net only surfaces clusters seen by two or more sensors). Recall (don't miss real fires): multi-sensor agreement can't help when only one satellite saw the fire, which is the common case for small fires. Recovering those needs mechanisms that work on a *single* detection — the polar-anchored threshold relaxation that re-arms our own detectors at a reported location [0019], and temporal persistence (the same satellite seeing the spot on consecutive passes).
Caveat. Two-week window; clustering at ~1 km may merge or split some events; "single-platform precision 0.40" is candidate-level, not shipped precision (the gating stack lifts it). The robust finding: multi-sensor agreement roughly doubles precision *and* additively recovers ~12% of otherwise-invisible missed fires at that high precision — with the remaining recall to be won by single-detection mechanisms.
Claim status: SUPPORTED.
Current literature & PHOENIX alignment.Verdict: AGREEMENT — multi-sensor fusion and event-based confirmation are exactly the directions the current literature endorses.
What the external literature reinforces: High-temporal multi-source fusion [2] and FCI event tracking [5][7] support cross-instrument confirmation; PHOENIX adds the operational 'confirm-up only' rule.
Where PHOENIX is stricter or diverges: Agreement between two sensors confirms strongly, but coverage is partial (only a fraction of fires are co-observed), so absence of a second sensor must never reject a candidate.
What this post does not claim: Multi-sensor precision figures (~99%) apply only to the subset of fires multiple sensors happen to see; they are not a system-wide recall claim.
Next research test: Wire higher-cadence FCI/SLSTR/MODIS into the voter; quantify the co-observation coverage fraction per fire class; add provenance/source-independence audits to the corroboration logic.
Public data sources:NASA FIRMS active-fire archive + area API (VIIRS/MODIS/SLSTR truth) · EUMETSAT Data Store MSG-SEVIRI L1.5 · EUMETSAT Data Store MTG-FCI L1c / FCI-AF L2 · Copernicus Data Space Sentinel-3 SLSTR. Every figure in this entry is reproducible from these public sources with no access to PHOENIX infrastructure; the method is stated above and in any linked code.
Statistical reporting: proportions are quoted with Wilson 95% confidence intervals and ranking metrics (AUC) with bootstrap 95% CIs; read the interval and the sample size n, not the point estimate. A shuffled-label placebo (≈0.5) accompanies learned separability claims.
entry 0029
Waiting for the second look: temporal persistence recovers a third of the single-pass misses
The analogy. Most missed small fires are seen by just one satellite pass, but if we wait for the next pass about 29% of them light up a second time — and a spot that flares twice is far more likely to be a real fire (74% vs 54% for one-and-done), so a "wait for the second look" rule recovers roughly a third of these misses by trading a little time for more confidence.
BLUF. Most of the small fires we miss are seen by only a single satellite overpass, so multi-sensor agreement can't help them [0029]. But a different lever can: persistence over time. Of the single-pass fires our own detectors miss, about 29% are detected again on a second pass within the day, and those repeat detections are markedly more trustworthy — 74% real, versus 54% for one-and-done. So a "wait for the second look, then surface" rule could recover roughly a third of the single-pass miss class at decent precision, at the cost of a little latency (you wait for the next overpass). Together with multi-sensor agreement, the recall levers are stacking up.
Method. We took every VIIRS-detected fire our own detectors missed and counted the distinct sensing passes at that location within the day (the feed re-inserts each detection many times with the *same* sensing time, so we de-duplicated to distinct ~10-minute sensing bins to count genuine passes, not re-inserts). We split the missed fires into single-pass versus recurring (two or more passes) and measured each group's Sentinel-2-adjudicated precision. Read-only.
Result. Of 103 missed single-overpass clusters, 30 (29%) recurred on a second pass. Their precision was 0.74 (27 labeled), versus 0.54 for the single-pass group (39 labeled). Recurrence is both a recovery mechanism (the fire is seen again, so it can be surfaced) and a real-ness signal (a spot that lights up twice is more likely a real fire than transient sensor noise).
Why it matters. It maps the recall problem cleanly. The fires we miss split into: a small slice recoverable immediately by multi-sensor agreement (~12%, high precision [0029]); a larger slice — about a third — recoverable by waiting one overpass for a second detection (~29%, 0.74 precision); and the rest, genuine single-pass one-and-done detections, which remain the hard core and will need detector-side sensitivity gains (sub-pixel / super-resolution) rather than logic. The temporal lever trades latency for recall, so it suits a "caution, watch this" tier more than an instant high-confidence alert.
Caveat. 0.74 precision means roughly a quarter of recurring detections are still false, so this lever needs the gating stack (including the industrial-flare filter [0030]) before anything is surfaced; it is not a standalone confirmer. Two-week window; clustering at ~1 km. The multi-sensor and persistence slices partly overlap, so they don't simply add — but they are largely complementary mechanisms.
Claim status: SUPPORTED.
Current literature & PHOENIX alignment.Verdict: AGREEMENT — multi-sensor fusion and event-based confirmation are exactly the directions the current literature endorses.
What the external literature reinforces: High-temporal multi-source fusion [2] and FCI event tracking [5][7] support cross-instrument confirmation; PHOENIX adds the operational 'confirm-up only' rule.
Where PHOENIX is stricter or diverges: Agreement between two sensors confirms strongly, but coverage is partial (only a fraction of fires are co-observed), so absence of a second sensor must never reject a candidate.
What this post does not claim: Multi-sensor precision figures (~99%) apply only to the subset of fires multiple sensors happen to see; they are not a system-wide recall claim.
Next research test: Wire higher-cadence FCI/SLSTR/MODIS into the voter; quantify the co-observation coverage fraction per fire class; add provenance/source-independence audits to the corroboration logic.
Public data sources:NASA FIRMS active-fire archive + area API (VIIRS/MODIS/SLSTR truth) · EUMETSAT Data Store MSG-SEVIRI L1.5 · EUMETSAT Data Store MTG-FCI L1c / FCI-AF L2 · Copernicus Data Space Sentinel-3 SLSTR. Every figure in this entry is reproducible from these public sources with no access to PHOENIX infrastructure; the method is stated above and in any linked code.
Statistical reporting: proportions are quoted with Wilson 95% confidence intervals and ranking metrics (AUC) with bootstrap 95% CIs; read the interval and the sample size n, not the point estimate. A shuffled-label placebo (≈0.5) accompanies learned separability claims.
entry 0031
Are the fires we surface real? An independent-corroboration audit — and a sensor that ignores the floor
The analogy. We asked whether the fires we flag are real or just one satellite agreeing with itself, and checked each unconfirmed case against completely different instruments: four of five carried independent backing (another satellite, a radar pass, or a smoke-gas plume), while the weakest lone signal had none and is the likeliest false alarm — and radar stood out because it senses the scorched ground itself, through cloud, darkness, and regardless of a fire's heat.
BLUF. Our safety-net surfaces strong fire clusters that our own detectors miss, and most are still "pending" — waiting on a burn-scar check to confirm them. A fair worry is that these are just the same satellite agreeing with itself. So we audited each pending cluster against *independent* sources — instruments and physics other than the one that surfaced it. Four of five carry independent backing: a different satellite, a radar pass, an atmospheric-gas plume. One — the weakest, a 2 MW signal — has none, seen only by the polar weather satellite, and we flag it as the most likely to be spurious. The standout is radar: one fire was independently confirmed by Sentinel-1 synthetic-aperture radar, which detects the ground changing regardless of how hot the fire is, whether it is day or night, or whether cloud is in the way. That makes it the one corroboration source that does not share the detection floor everything else runs into.
The audit. For each pending cluster we listed every fire-related observation within about five kilometres that did *not* come from the polar fire product that surfaced it. The picture: the strongest case (a 5 MW cluster on the west coast) was seen by three independent physics at once — a second geostationary fire product, Sentinel-1 radar surface-change, and the low-light "day-night band." The persistent 24 MW western source was seen by the dual-view radiometer and the low-light band, multi-instrument agreement that — combined with its repetition over many days — fits an industrial flare more than a wildfire, consistent with our watch-list note on it. Two mid-strength clusters were each backed by a TROPOMI atmospheric plume (nitrogen dioxide in one case, formaldehyde in the other — both fire-combustion gases). The lone 2 MW cluster had nothing but the three passes of the polar instrument: real-looking, but uncorroborated, and the first we would expect to fall away.
Why radar matters. Every recall idea we have tested and retired this stretch — sharpening sub-pixel hotspots, scoring single candidates, detecting smoke in visible or atmospheric bands — runs into the same wall: a small fire is physically too small, too cool, or too cloud-obscured for an optical or thermal sensor to see. Synthetic-aperture radar does not work that way. It measures the roughness and dielectric properties of the surface, so a burned patch looks different from an unburned one whether it is hot or cold, lit or dark, clear or overcast. It is slower — a satellite revisit every week or so, and it sees the *aftermath* rather than the live flame — so it is a confirmation tool, not an early alarm. But it is the one independent physics that does not share the floor, and it already corroborated a fire in this very small sample.
What this does and doesn't change. It does not move our scoreboard: independent satellite agreement raises our confidence that a pending cluster is a real fire, but it is not ground truth — several satellites can all see one persistent non-fire source, which is exactly the flare trap. So the pending clusters stay pending until a burn scar or a ground report settles them, and our published precision is unchanged. What it does change is the texture of the picture: the fires we surface are, in the main, not one sensor talking to itself — they carry the fingerprints of several. And it points to the next thing worth pulling on: whether radar, precisely because it ignores the floor, can corroborate fires our heat-seeking detectors never saw at all.
Claim status: SUPPORTED.
Current literature & PHOENIX alignment.Verdict: AGREEMENT — multi-sensor fusion and event-based confirmation are exactly the directions the current literature endorses.
What the external literature reinforces: High-temporal multi-source fusion [2] and FCI event tracking [5][7] support cross-instrument confirmation; PHOENIX adds the operational 'confirm-up only' rule.
Where PHOENIX is stricter or diverges: Agreement between two sensors confirms strongly, but coverage is partial (only a fraction of fires are co-observed), so absence of a second sensor must never reject a candidate.
What this post does not claim: Multi-sensor precision figures (~99%) apply only to the subset of fires multiple sensors happen to see; they are not a system-wide recall claim.
Next research test: Wire higher-cadence FCI/SLSTR/MODIS into the voter; quantify the co-observation coverage fraction per fire class; add provenance/source-independence audits to the corroboration logic.
Public data sources:NASA FIRMS active-fire archive + area API (VIIRS/MODIS/SLSTR truth) · EUMETSAT Data Store MSG-SEVIRI L1.5 · EUMETSAT Data Store MTG-FCI L1c / FCI-AF L2 · Copernicus Data Space Sentinel-3 SLSTR. Every figure in this entry is reproducible from these public sources with no access to PHOENIX infrastructure; the method is stated above and in any linked code.
Statistical reporting: proportions are quoted with Wilson 95% confidence intervals and ranking metrics (AUC) with bootstrap 95% CIs; read the interval and the sample size n, not the point estimate. A shuffled-label placebo (≈0.5) accompanies learned separability claims.
entry 0039
When the ground truth flickers — making the burn-scar gate robust to cloud
The analogy. Our after-the-fact "did it really burn?" check was giving wildly different answers minute to minute (88%, then 75%, then 86%) because one fire sat under cloud and the satellite kept flickering between "burned" and "unburned" — so we stopped trusting the latest reading and now take the steady middle value, and honestly set aside any case the clouds won't let us judge rather than guessing.
BLUF. We grade our fire safety-net by checking, after the fact, whether each surfaced cluster left a burn scar in Sentinel-2 imagery. We noticed our pass-rate jumping — 88%, then 75%, then 86% — within minutes, with no change to the underlying fires. The cause was a single cluster sitting under cloud, whose burn-scar measurement was bouncing between "burned" and "unburned" from one satellite pass to the next, and our scorer was trusting whichever reading happened to land last. That is a fragile way to decide ground truth. We fixed the scorer to use the *median* of all post-fire readings and to refuse to label any cluster whose readings disagree by more than a burn signal's worth — leaving such cases undecided rather than guessing. The pass-rate is now stable and the decision is honest: one cloud-obscured cluster is held as "pending" until a clean image settles it, instead of yanking the whole score around.
What happened. The differenced burn index (dNBR) is reliable only on a clear scene; cloud, haze, and shadow can push it anywhere. For one 10 MW cluster, the post-fire readings across passes ran from about 0.01 (looks unburned) to 0.12 (looks like a low-severity burn), with a couple of transient values swinging strongly negative — a spread of more than 0.2, which is larger than the difference between "burned" and "unburned" in the first place. We had independently seen, while testing a smoke detector, that this exact location was under cloud. So the instrument was not telling us about the fire; it was telling us about the weather over the fire. Yet our scorer took the single most recent reading as gospel, so each time a new pass landed the cluster flipped between true-positive and false-positive and the headline precision lurched with it.
The fix. Two changes to our own scoring script — not to any live detector. First, instead of the last reading, use the median of all post-fire readings, which a single cloud-corrupted pass cannot drag around. Second, add an explicit reliability gate: if the readings for a cluster disagree by more than a burn signal's magnitude, declare the measurement unreliable and leave the cluster *pending* rather than force a verdict. This is deliberately conservative — it never promotes an uncertain case to "real fire," it only declines to count it against us until the evidence is clean. The genuinely settled cases are untouched: a cluster whose readings sit consistently near zero is still a clean false positive, and a consistent strong scar is still a confirmed fire.
Why it matters. A grading system that flickers is worse than useless for a go/no-go decision — it invites you to act on noise. By scoring with a robust statistic and openly setting aside what the sky won't let us see, the gate now reflects the fires rather than the weather: a stable reading, with cloud-obscured cases honestly parked as undecided until a clear pass arrives. It is a small change to a scoring script, but it is the difference between a number you can stand behind and one that moves while you watch it.
Claim status: SUPPORTED.
Current literature & PHOENIX alignment.Verdict: AGREEMENT with a careful scope split — optical/dNBR is valid for burned-area mapping but our negative shows it fails as per-detection confirmation.
What the external literature reinforces: Foundation-model burn mapping on Sentinel-2 [17][16][15] supports optical change for post-event burned-area/severity mapping; the FASDD corpus [3] anchors flame/smoke detection across domains.
Where PHOENIX is stricter or diverges: Burned-area mapping is not the same as confirming each active-fire pixel; crop/stubble burns and seasonal senescence confound per-detection dNBR in Sicily summer.
What this post does not claim: A negative dNBR-per-detection result does not invalidate Sentinel-2 for burned-area, severity or large-event mapping.
Next research test: Separate agricultural/stubble from forest/shrub fires via ESA WorldCover; re-run dNBR with cloud-free windows, crop masks and phenology controls; test foundation-model segmentation on post-event chips; use dNBR as a training-label filter, not live confirmation.
Public data sources:Element84 Earth Search / Copernicus Data Space Sentinel-2 L2A · Copernicus Data Space Sentinel-3 SLSTR · NASA FIRMS active-fire archive + area API (VIIRS/MODIS/SLSTR truth). Every figure in this entry is reproducible from these public sources with no access to PHOENIX infrastructure; the method is stated above and in any linked code.
Statistical reporting: proportions are quoted with Wilson 95% confidence intervals and ranking metrics (AUC) with bootstrap 95% CIs; read the interval and the sample size n, not the point estimate. A shuffled-label placebo (≈0.5) accompanies learned separability claims.
entry 0040
Is our "independent corroboration" really independent? Auditing the voter for source-confirms-source
Date: 2026-06-23 *(updated 2026-06-23 — see "Corrections" below: the anchored-prior table is not empty, and the second item is a design choice, not a bug)* Status: defensible (read-only live-system audit; one genuine defect — now fixed — and one open design decision)
The analogy. Two witnesses only count as two if they didn't talk to each other first. We asked a hard question about our own system: when we say "a second satellite independently agrees this is a fire," is that ever secretly the *first* satellite telling the second one where to look — and then being counted again as the second vote? We went into the live machinery and checked.
BLUF. PHOENIX raises confidence when independent instruments agree on a fire. But we also run a "FIRMS-anchored prior" [0019] that deliberately *relaxes our geostationary detectors' thresholds at a spot a polar satellite already flagged* — which is exactly the mechanism that could manufacture a fake second witness. We audited the live voter to see whether any "independently corroborated" fire is really the polar satellite confirming a detection it caused. Today the surfaced fires are clean: the anchored prior *is* firing — it has recorded thousands of threshold-relaxation windows — yet it has produced zero anchored detections, because the relaxed-gate detector that would consume those windows runs in shadow mode and currently emits nothing. So nothing anchor-induced has reached the surfaced set, and the 189 published multi-sensor events are genuine mixes of *physically distinct* instruments — a native EUMETSAT geostationary fire product, our own geostationary processing, and the polar satellites. The handful that pair a polar hit with one internal detector all predate any anchor activity. But we found two real defects and have queued fixes for both. The honest headline: our independence claims hold for the current data, and we now know precisely where the seams are.
What we own, and why this matters. PHOENIX operates no satellites — we process other people's. "Our detector" means our algorithm running on someone else's pixels. That makes independence a question of *which instrument* and *which physics*, not of hardware we own. Two of our detectors agreeing is only independent evidence if they ride different satellites and don't secretly share a trigger.
The audit. Read-only, on the live detection and voting database. We confirmed the live voter path, enumerated every published ("voted") fire, and broke down which detector families promoted each one. The dominant combinations are `{native-geostationary-L2 + our-geostationary-processing + polar}` — three different instruments. We then checked the anchored-prior provenance: the table that records threshold-relaxation windows holds thousands of rows (the prior is active), but no detection in the database carries the anchored-source tag — the relaxed-gate detector that would consume those priors runs in shadow mode and is currently emitting nothing. So there is currently nothing anchor-induced to discount, and the independence of the surfaced set is intact.
One genuine defect, and one open design question. (1) *A latent circular promotion (defect).* Buried in an anchored-prior enrichment routine is logic that, for a detection produced *because* of a polar anchor, counts the polar prior itself as the "implicit second voter" and auto-promotes the cluster to high-confidence. That is the source confirming itself — a real defect. It is wired into a script that is not the one running in production, so it is dormant; we are guarding it so it can never fire. (2) *A platform-counting choice worth a second look (not a bug).* Our main voter deliberately collapses all the polar fire sub-products — the two VIIRS platforms, MODIS, and so on — into a single "polar" witness, so the same sensor family can't vote twice. But a separate fast-track module, built to surface a fire the moment two satellites agree, *intentionally* counts distinct physical platforms instead: NOAA-20 and NOAA-21 seeing the same fire forty-seven minutes apart promote it as a two-witness event. That is a defensible call — two different satellites at two different times do rule out a single-pass glitch — but a debatable one, because they share the same instrument design and detection algorithm, and therefore share systematic biases. It produced exactly one such event in our set, offshore and low-stakes. We are flagging it as an open independence-standard question — should fast-track require two distinct *instrument types*, not just two platforms? — rather than dressing a deliberate design choice up as a settled bug.
What this changes. Nothing about the current published precision — the surfaced fires are independently corroborated as claimed, by genuinely distinct instruments. What changes is rigor going forward: we are wiring the anchored-prior join as a standing guard so that if the anchor ever does start firing, any geostationary vote it induced is automatically discounted rather than silently counted as independent; we are closing the dormant circular-promotion path; and we are putting the platform-versus-instrument independence question on the table for an explicit decision. The discipline this enforces: a corroboration is only as independent as the trigger and the sensor behind it, and the only way to know is to audit your own plumbing against the worst-case reading — which is what we did, including correcting our own first description of what we found.
Corrections (2026-06-23). Two same-day corrections, logged in the open because that is the point of this record. *(a)* Our first write-up said the anchored-prior table was *empty*; that was a query error on our side. The table in fact holds thousands of relaxation windows — the prior is firing. What is true, and what actually keeps the surfaced set independent, is the next link: the relaxed-gate detector that would turn those windows into detections runs in shadow mode and produces zero detections, so nothing anchor-induced reaches the output. *(b)* We first called the two-VIIRS-platform event a "rule violation"; on reading the code it is a deliberate, documented fast-track design choice (count distinct physical platforms), not an accidental bug — reframed above as an open design decision. The independence conclusion is unchanged; the reasons behind it are now stated correctly. The dormant relaxed-gate detector is itself a separate and more interesting thread — it is the very recall mechanism that should be recovering fires we miss — and we pick it up in [0054].
Claim status: CORRECTED / SUPERSEDED.
Current literature & PHOENIX alignment.Verdict: AGREEMENT — multi-sensor fusion and event-based confirmation are exactly the directions the current literature endorses.
What the external literature reinforces: High-temporal multi-source fusion [2] and FCI event tracking [5][7] support cross-instrument confirmation; PHOENIX adds the operational 'confirm-up only' rule.
Where PHOENIX is stricter or diverges: Agreement between two sensors confirms strongly, but coverage is partial (only a fraction of fires are co-observed), so absence of a second sensor must never reject a candidate.
What this post does not claim: Multi-sensor precision figures (~99%) apply only to the subset of fires multiple sensors happen to see; they are not a system-wide recall claim.
Next research test: Wire higher-cadence FCI/SLSTR/MODIS into the voter; quantify the co-observation coverage fraction per fire class; add provenance/source-independence audits to the corroboration logic.
Public data sources:NASA FIRMS active-fire archive + area API (VIIRS/MODIS/SLSTR truth) · EUMETSAT Data Store MSG-SEVIRI L1.5 · EUMETSAT Data Store MTG-FCI L1c / FCI-AF L2 · Copernicus Data Space Sentinel-3 SLSTR. Every figure in this entry is reproducible from these public sources with no access to PHOENIX infrastructure; the method is stated above and in any linked code.
Statistical reporting: proportions are quoted with Wilson 95% confidence intervals and ranking metrics (AUC) with bootstrap 95% CIs; read the interval and the sample size n, not the point estimate. A shuffled-label placebo (≈0.5) accompanies learned separability claims.
entry 0050
Two satellites agreeing is a near-perfect fire confirmation — for the third of fires both happen to see
Date: 2026-06-25 Status: defensible (complete FIRMS archive, 35,008 VIIRS + 6,773 MODIS detections 2019–2024; cross-sensor agreement as a confidence signal, with a verified check on the volcano result) — a positive safety-net result with a hard coverage limit and the usual rule attached
The analogy. If two independent witnesses describe the same event, you believe it. Two different fire satellites flagging the same spot at the same time is almost always a real fire — near-perfect confirmation. The catch is coverage: both satellites only happen to catch the same fire about a third of the time. So agreement confirms strongly, but its absence must never reject — a positive result with an honest limit.
The last entry showed that telling a real fire from a furnace needs to know *where the furnace always is* — a location-persistence prior. That prior is powerful but it has a cost: it needs a catalog, and a catalog can only flag sources it has already watched recur. So it is worth asking whether there is an independent confirmation signal that needs no catalog at all — and the obvious candidate is a second satellite. Sicily is watched by two different thermal instruments on different platforms: the 375-metre VIIRS imager on NOAA-20 and the 1-kilometre MODIS imagers on Terra and Aqua. If both independently flag a hot spot at the same place on the same day, that agreement ought to mean something. The question this entry asks is whether it means what you would naively hope — and we went in expecting the *opposite* of what we found.
The worry was this: persistent sources are always hot, so two sensors should agree on them *more* often than on a transient fire that one sensor happens to catch between the other's overpasses — which would make naive "both agree → high confidence" fusion quietly *upweight* the volcano and the refinery. The data say the reverse, and emphatically. Of the 35,008 VIIRS detections, those that have a same-day MODIS detection within about a kilometre are 33.9% of vegetation fires but 0.0% of volcano, 1.8% of static-industrial, and 2.7% of offshore detections. Among everything VIIRS flags, 12.2% are non-fire sources; among the subset that a second satellite confirms, that falls to 0.5% — a more than twenty-fold gain in purity. Two satellites agreeing is, in this archive, a 99.5%-pure fire signal, and it requires no location database whatsoever.
The volcano number — exactly zero out of 1,881 — was suspicious enough to verify before trusting, because a clean zero is as often a bug as a fact. It is a fact. When VIIRS flags Etna's volcanic heat, the nearest same-day MODIS detection anywhere in Sicily sits a median of 49 kilometres away, and not one is within two kilometres. MODIS detects the Etna area only 87 times in six summers against VIIRS's thousands, because Etna's persistent anomaly is a small, largely nocturnal hot spot that a 1-kilometre nighttime pixel simply does not register. That is the mechanism behind the whole result: the persistent false sources are *weak* and *nocturnal* — 95% of them are night detections, as the previous entry found — and a coarser instrument on a different orbit misses them. A real vegetation fire is hot, often daytime, and big enough that when the two overpasses overlap both sensors see it. Agreement filters furnaces not because it knows they are furnaces, but because furnaces are too faint for two independent eyes to catch at once.
The limit is just as important as the result, and it is a limit of *coverage*, not of trust. Only about a third of real fires are corroborated, and the reason is orbital, not physical: VIIRS and MODIS cross Sicily at different times, so a fire that is burning during one pass and not the other, or that flares between overpasses, is seen once and confirmed never. The two-thirds of vegetation fires with no second-sensor match are overwhelmingly real fires the other satellite's orbit missed, not false alarms — which means cross-sensor agreement can only ever be a signal that promotes confidence *upward*, never one that rejects. To treat a single-sensor detection as suspect because it lacks a partner would be to throw away most of the real fires on the island, the exact failure this project refuses. Agreement is a confirm-up tier; silence from the second sensor means nothing.
Put beside the previous entry, the two results compose into a clean tiered-confidence design that uses each signal for what it is good at. A detection that two satellites confirm is a near-certain fire, instantly, with no catalog — the highest-confidence tier, covering about a third of fires. A single-sensor detection that does *not* sit on a known persistent-source location is a probable fire to be acted on. A single-sensor detection that *does* sit on a recurring hot-spot is the one to treat as a likely furnace. Persistence catches the false sources by remembering where they are; cross-sensor agreement confirms the real ones by catching them twice at once; and neither is asked to do the other's job. The catalog-free confirmation is the genuinely new piece — a way to mark a third of Sicily's fires as high-confidence in real time from two public feeds, before any location prior has had a chance to learn anything.
Claim status: SUPPORTED.
Current literature & PHOENIX alignment.Verdict: AGREEMENT — multi-sensor fusion and event-based confirmation are exactly the directions the current literature endorses.
What the external literature reinforces: High-temporal multi-source fusion [2] and FCI event tracking [5][7] support cross-instrument confirmation; PHOENIX adds the operational 'confirm-up only' rule.
Where PHOENIX is stricter or diverges: Agreement between two sensors confirms strongly, but coverage is partial (only a fraction of fires are co-observed), so absence of a second sensor must never reject a candidate.
What this post does not claim: Multi-sensor precision figures (~99%) apply only to the subset of fires multiple sensors happen to see; they are not a system-wide recall claim.
Next research test: Wire higher-cadence FCI/SLSTR/MODIS into the voter; quantify the co-observation coverage fraction per fire class; add provenance/source-independence audits to the corroboration logic.
Public data sources:NASA FIRMS active-fire archive + area API (VIIRS/MODIS/SLSTR truth) · EUMETSAT Data Store MSG-SEVIRI L1.5 · EUMETSAT Data Store MTG-FCI L1c / FCI-AF L2 · Copernicus Data Space Sentinel-3 SLSTR. Every figure in this entry is reproducible from these public sources with no access to PHOENIX infrastructure; the method is stated above and in any linked code.
Statistical reporting: proportions are quoted with Wilson 95% confidence intervals and ranking metrics (AUC) with bootstrap 95% CIs; read the interval and the sample size n, not the point estimate. A shuffled-label placebo (≈0.5) accompanies learned separability claims.
entry 0073
The optical channel doesn't make the cut: burn scars can't confirm a Sicily fire one detection at a time
Date: 2026-06-25 Status: clean negative (complete FIRMS archive; Sentinel-2 dNBR burn-scar corroboration of vegetation-fire vs static-source detections, ~138 sites, tested at two independent pre/post window widths) — a hypothesized third confirmation channel that does not survive contact with the data
The analogy. We hoped a completely different physics — optical burn scars — could be a third independent way to confirm a fire. Tested one detection at a time across ~138 sites and two window widths, it failed: scars can't separate real Sicily fires from static sources at the single-detection level. A clean negative — we keep optical for mapping burned areas later, not for confirming alerts now.
The last two entries built a tiered confidence design from two independent signals: location-persistence catches the false sources by remembering where they always are, and cross-sensor agreement confirms real fires by catching them on two satellites at once. The natural next move was a *third* channel from a completely different physics — optical. A real vegetation fire leaves a burn scar: the post-fire surface drops sharply in the normalized burn ratio, computed from Sentinel-2's near-infrared and shortwave bands, while a refinery or other static hot source sitting on built or bare ground has no vegetation to char and should show no scar. If that held, an optical burn-scar check would independently confirm that a detection was a real fire, completing the design with three orthogonal channels. It does not hold, and the honest version of why is the point of this entry.
We sampled the complete archive — about seventy vegetation-fire detections (type 0) and seventy static-source detections (type 2), deduplicated to unique ~1 km sites — and computed a cloud-masked, single-scene dNBR across a window before and after each detection's own date. Because window width is a real methodological choice that can manufacture a result, we ran it twice: once with wide 55-day windows and once with tight ±3-week windows, the latter specifically to strip out the summer vegetation-senescence drift (green canopy browning to straw over the season) that inflates dNBR everywhere regardless of fire. The wide windows gave a vegetation scar-rate of 53% against 37% for static sources; the tight windows lowered both to 42% against 28%. The seasonal drift was real and the tight windows removed it — but the gap between the two classes barely moved, holding at about fourteen points in both. A separation that survives only as a fourteen-point difference between 42% and 28% is not a per-detection confirmation; it is a population tendency with too much overlap to act on one fire at a time.
The single most damning number is at the other threshold. If we ask not for a faint scar (dNBR ≥ 0.10) but for an unambiguous one (dNBR ≥ 0.27, the level that genuinely means *this ground burned*), vegetation-fire sites and static-source sites come out essentially equal — 7% versus 9%. A strong burn scar is no more likely to sit under a real fire detection than under a static one. That kills the channel cleanly: a detectable scar simply does not carry the information "this was a fire," because the things that produce strong dNBR in summer Sicily are not exclusively fires. The medians do separate — vegetation dNBR runs three to four times higher than static in aggregate — so there *is* a faint population-level signal that real fires scar more on average. But averages do not confirm individual detections, and individual confirmation was the whole job.
Two compounding reasons explain it, and both were partly foreseeable from earlier work. First, dNBR in summer Sicily is intrinsically noisy: much of what burns here is grass, stubble and agricultural land that scars weakly or transiently, and the landscape is a senescing mosaic that moves the burn ratio around for reasons that have nothing to do with fire — exactly the noise an earlier entry flagged when a cleaner burn-scar method corrected our own corroboration number. Second, the "static land source" label is heterogeneous: it is not all refineries on concrete. Several type-2 sites sit on or beside burnable terrain and genuinely scar — one inland site posted a strong dNBR of +0.29 in *both* window runs — so the class is not the clean built-surface negative control the hypothesis assumed. Between a noisy index and an impure control, the optical channel cannot draw the per-detection line.
The conclusion is a boundary on the design rather than a new capability, and it is worth stating plainly because the temptation to add a third channel was real. The tiered confidence system has two reliable channels, not three: persistence to remember the furnaces, cross-sensor agreement to confirm the fires, and — for Sicily summer at least — no per-event optical confirmation, because a single burn-scar reading cannot tell a real fire from a senescing field or a static source often enough to be trusted on its own. Optical change detection remains useful at the population level and for after-the-fact area mapping, where averaging over many pixels and a clear post-season scene recovers the signal this per-detection test cannot. But as a real-time, one-detection-at-a-time confirmation that a thermal anomaly was a fire, it does not make the cut, and the design is stronger for knowing that than for carrying a third channel that quietly confirms the wrong things one time in four.
Claim status: NEGATIVE (clean).
Current literature & PHOENIX alignment.Verdict: AGREEMENT with a careful scope split — optical/dNBR is valid for burned-area mapping but our negative shows it fails as per-detection confirmation.
What the external literature reinforces: Foundation-model burn mapping on Sentinel-2 [17][16][15] supports optical change for post-event burned-area/severity mapping; the FASDD corpus [3] anchors flame/smoke detection across domains.
Where PHOENIX is stricter or diverges: Burned-area mapping is not the same as confirming each active-fire pixel; crop/stubble burns and seasonal senescence confound per-detection dNBR in Sicily summer.
What this post does not claim: A negative dNBR-per-detection result does not invalidate Sentinel-2 for burned-area, severity or large-event mapping.
Next research test: Separate agricultural/stubble from forest/shrub fires via ESA WorldCover; re-run dNBR with cloud-free windows, crop masks and phenology controls; test foundation-model segmentation on post-event chips; use dNBR as a training-label filter, not live confirmation.
Public data sources:Element84 Earth Search / Copernicus Data Space Sentinel-2 L2A · Copernicus Data Space Sentinel-3 SLSTR · NASA FIRMS active-fire archive + area API (VIIRS/MODIS/SLSTR truth). Every figure in this entry is reproducible from these public sources with no access to PHOENIX infrastructure; the method is stated above and in any linked code.
Statistical reporting: proportions are quoted with Wilson 95% confidence intervals and ranking metrics (AUC) with bootstrap 95% CIs; read the interval and the sample size n, not the point estimate. A shuffled-label placebo (≈0.5) accompanies learned separability claims.
entry 0074
A fire that burns two days is a different animal: multi-day persistence as an independent confidence signal
Date: 2026-06-25 Status: defensible (complete VIIRS archive, 30,749 vegetation-fire detections clustered into 11,132 space-time events; multi-day persistence cross-checked against cross-sensor corroboration, controlled for fire intensity) — a positive result, and the third confirmation channel that the optical one failed to be
The analogy. A fire still burning tomorrow is a different animal from a one-afternoon flicker. We tested whether ‘it lasted multiple days’ is an independent confirmation signal, controlling for fire intensity. It is — clustering six years of detections into space-time events, multi-day persistence genuinely marks real fires, succeeding where the optical channel failed. The grade is agreement with cross-sensor confirmation; this became the third confirmation channel.
The recent safety-net entries found two signals that genuinely tell a real wildfire from a false hot source — location-persistence to recognise the furnaces, cross-sensor agreement to confirm the fires — and one that did not, the optical burn-scar, which could not separate them one detection at a time. This entry tests a fourth idea from a different axis entirely: *time*. A volcano or refinery is persistent across years at a fixed point, and that is the furnace signature the first entry used. But a real wildfire has its own, different temporal signature — it burns for several consecutive days and then stops. The question is whether that bounded multi-day persistence carries information a single snapshot does not: whether a detection that is part of a multi-day burn is more likely to be a real, significant fire than a one-off detection that never repeats. To keep this cleanly separate from the furnace signal, the whole analysis is restricted to vegetation-fire detections only, so the static sources the first entry already handles are not in the picture.
Clustering the detections in space and time — grouping anything within about two kilometres and one day into a single event — turns 30,749 detections into 11,132 events, and the shape of that distribution is the first result. Eighty-eight percent of events are single-day: a fire detected, and gone by the next overpass. Only 12% span two days or more, just 70 span four or more, and none last beyond seven — which is itself a useful confirmation that these are transient fires and not mislabeled permanent sources, since a furnace would burn for the whole season. But that small minority of multi-day events is where the fire actually is: the 12% of events that persist hold 40% of all detections and 50% of all the fire radiative power in the archive. Most fire events are small and brief; a handful of multi-day burns carry half the energy. For a system deciding where to spend attention, the event a detection belongs to matters as much as the detection itself.
The confidence signal is strong and, more importantly, it is *independent*. Detections that belong to a multi-day event are corroborated by the second satellite 50.5% of the time, against 22.8% for single-day detections — more than double. The obvious objection is that multi-day fires are simply bigger, and bigger fires are easier for two sensors to both catch, so this might be nothing more than fire radiative power in disguise. It is not. Holding intensity fixed and comparing within power bands, multi-day detections are more corroborated than single-day ones in every band without exception: among the weakest fires under 2 megawatts, multi-day membership raises the cross-sensor confirmation rate from 7.7% to 26.3%; in the 2-to-5 band, from 16% to 40%; from 5 to 15, from 30% to 57%; and even among the strongest fires, from 53% to 76%. The temporal signal carries real-fire information that intensity does not — a fire seen again the next day is more likely to be genuine than a fire of the same size seen only once, independent of how bright it was.
Where that matters most is exactly where the other signals are weakest. The previous two entries established that small daytime fires sit below the detector's daylight floor and that the supplied confidence field cannot be trusted to keep them — the faint, low-power detections are the ones a naive pipeline is most tempted to discard and least able to verify on a single frame. Multi-day persistence reaches precisely those detections: a sub-2-megawatt fire, the kind most likely to be missed or mistrusted, is three and a half times more likely to be a real fire if it reappears the next day than if it does not. Time recovers confidence for the small fires that single-frame radiometry, the confidence label, and the daytime sensitivity floor all fail. A detector that cannot be sure of a faint afternoon fire from one look can be much more sure of it from two looks a day apart.
So the third confirmation channel exists after all — it is just temporal rather than optical. The optical burn-scar was supposed to be the independent third check on the persistence-and-cross-sensor design and could not separate fire from field; multi-day persistence quietly does the job it was meant to, from data already in hand and with no extra sensor. The composed picture is now four signals doing four jobs: across-year persistence at a fixed point flags the furnaces, cross-sensor agreement confirms a fire instantly when two satellites overlap, multi-day persistence confirms it over the following days when they do not — and crucially does so for the faint fires the instantaneous channels miss — while the confidence label and the single-frame burn scar are kept out of the filtering decision because they answer the wrong question. The operational rule that falls out is simple and safe: a detection that repeats is a detection to trust, a brief faint singleton is one to hold and watch rather than discard, and severity should be read at the level of the multi-day event, where half the island's fire energy actually lives.
Claim status: SUPPORTED (confirmation).
Current literature & PHOENIX alignment.Verdict: AGREEMENT — multi-sensor fusion and event-based confirmation are exactly the directions the current literature endorses.
What the external literature reinforces: High-temporal multi-source fusion [2] and FCI event tracking [5][7] support cross-instrument confirmation; PHOENIX adds the operational 'confirm-up only' rule.
Where PHOENIX is stricter or diverges: Agreement between two sensors confirms strongly, but coverage is partial (only a fraction of fires are co-observed), so absence of a second sensor must never reject a candidate.
What this post does not claim: Multi-sensor precision figures (~99%) apply only to the subset of fires multiple sensors happen to see; they are not a system-wide recall claim.
Next research test: Wire higher-cadence FCI/SLSTR/MODIS into the voter; quantify the co-observation coverage fraction per fire class; add provenance/source-independence audits to the corroboration logic.
Public data sources:NASA FIRMS active-fire archive + area API (VIIRS/MODIS/SLSTR truth) · EUMETSAT Data Store MSG-SEVIRI L1.5 · EUMETSAT Data Store MTG-FCI L1c / FCI-AF L2 · Copernicus Data Space Sentinel-3 SLSTR. Every figure in this entry is reproducible from these public sources with no access to PHOENIX infrastructure; the method is stated above and in any linked code.
Statistical reporting: proportions are quoted with Wilson 95% confidence intervals and ranking metrics (AUC) with bootstrap 95% CIs; read the interval and the sample size n, not the point estimate. A shuffled-label placebo (≈0.5) accompanies learned separability claims.
entry 0077
The truth arrives nine hours late
Date: 2026-06-26 Status: defensible (end-to-end detection→ingest latency measured on ~110k real feed records across 16 sources; comparison drawn between timezone-unambiguous UTC-stamped external feeds)
The analogy. A fire alarm's worth is decided less by how accurate it is than by how late it rings. We measured, for 110,000 real records across 16 feeds, the gap between when a fire was detected and when PHOENIX actually got the data. The answer reorganises the whole stack: the most trusted ground-truth (polar FIRMS) arrives about nine hours late. The grade is pure latency — two timestamps, no modelling.
PHOENIX exists to raise the alarm early. That goal quietly decides which sensors can do which job, and the deciding factor is not how *accurate* a sensor is but how *late* its data arrives. So we measured it directly: for every fire record from every feed, the gap between the fire's physical detection time and the moment PHOENIX actually receives the data. No modelling, no labels — just two timestamps per record across roughly 110,000 of them. The answer reorganizes how you should think about the whole sensor stack, because the feeds everyone treats as "ground truth" turn out to be the slowest things in the building.
The cleanest comparison is between two *external* feeds whose timestamps are both unambiguous UTC, so no clock convention can confound them. EUMETSAT's geostationary active-fire product, mtg_af_l2, reaches PHOENIX a median of 23 minutes after detection (10th–90th percentile 20–29 min) — it watches Sicily continuously from 36,000 km and ships a detection within the half-hour. NASA's FIRMS VIIRS, the polar-orbiting product that the wildfire community (and much of our own validation) treats as the reference answer, arrives a median of 9.1 hours later for NOAA-20, 8.8 h for SNPP, 8.6 h for NOAA-21. The two products look at the same island and both find real fires; one is useful for a first alert and the other simply is not, and the difference is two orders of magnitude in time. That gap is not a flaw in VIIRS — it is the price of a 375-metre polar instrument that must overpass, downlink, and run NASA's near-real-time processing before anyone sees it.
Sort every feed this way and a clear three-tier structure falls out, defined purely by latency. First-alert tier (minutes): the geostationary products — mtg_af_l2 at 23 min, and PHOENIX's own in-house detectors that run on the live MTG feed and surface within their processing cycle (their raw timestamps are locally-stamped so we won't quote a false-precision number, but they sit firmly in this fast class, which is the entire reason we run them). Ground truth from the Vigili del Fuoco also lands here — it's logged the moment it's phoned in. Confirmation tier (hours): FIRMS MODIS at 6.6 h, Sentinel-3 SLSTR at 7.1–7.4 h, FIRMS VIIRS at ~9 h, the TROPOMI atmospheric products at 16 h. Forensic tier (days): Sentinel-1 SAR change at a median of 12.5 days, Landsat-8 at 15.8 days, MAIAC smoke at 17.7 days. These last three are the burn-scar and change-detection sensors we lean on to *confirm* a fire happened — and they cannot, by their orbital nature, tell you anything until the fire is long out.
This is the operational backbone behind a result we already published — that the high-resolution sensors are a *confirmation* net, not a detection net (the multi-sensor safety-net thread). Now we can say *why* in hard numbers: it is not mainly that they miss small fires, it is that they arrive hours to weeks late. An architecture that waited for FIRMS to declare a fire before acting would be, on average, nine hours behind the event — long enough for a Sicilian summer fire to run from a roadside ignition to hectares of burned ground. PHOENIX's design answer is the only one the latencies allow: detect on the geostationary feed in minutes, then let the slower, sharper, higher-resolution instruments roll in over the following hours and days to confirm, grade and learn from what was already flagged. The fast sensor sounds the alarm; the slow sensors write the history.
Two honesties bound the claim. These are *end-to-end* latencies as PHOENIX experiences them — they fold the producer's processing delay together with our own polling cadence, so the ~9 h for VIIRS is "time until PHOENIX can act," not VIIRS's intrinsic spec (NASA's NRT target is tighter; our pull schedule adds to it, and tightening that schedule is a concrete lever worth pulling). And the in-house detectors are deliberately excluded from the precise ranking because their timestamps are locally-stamped rather than UTC; the timezone-safe comparison that carries the argument is geostationary-external (23 min) versus polar-external (9 h), and that gap is real, large, and not an artifact.
Claim status: SUPPORTED.
Current literature & PHOENIX alignment.Verdict: strong AGREEMENT — the newest 2025-2026 FCI literature directly corroborates PHOENIX's FCI-first strategy.
What the external literature reinforces: Xu et al. [5] report MTG-FCI detects fires earlier and finds many more active-fire pixels than SEVIRI, with improved small-fire FRP; Paugam et al. [6][7] derive fire-arrival maps, rate-of-spread and persistent event IDs from FCI — the event-tracking direction PHOENIX has queued; EUMETSAT [8] confirms the operational mandate.
Where PHOENIX is stricter or diverges: Literature reports the instrument's potential; PHOENIX additionally requires demonstrable ingest freshness (latest product timestamp, candidate-creation proof) before any operational claim — a system-health condition the papers do not address.
What this post does not claim: FCI should not be framed merely as a SEVIRI replacement, nor as operational while ingest is stale; it is an event tracker, early-detection source, FRP/ROS source and fusion input.
Next research test: Build the FCI event tracker (space-time clustering, persistent IDs, FRP time-series, growth direction); add a time-to-first-candidate metric per real event; compare against FIRMS/VIIRS/MODIS/SLSTR and EFFIS/Copernicus EMS perimeters.
Public data sources:EUMETSAT Data Store MTG-FCI L1c / FCI-AF L2 · EUMETSAT Data Store MSG-SEVIRI L1.5 · NASA FIRMS active-fire archive + area API (VIIRS/MODIS/SLSTR truth). Every figure in this entry is reproducible from these public sources with no access to PHOENIX infrastructure; the method is stated above and in any linked code.
Statistical reporting: proportions are quoted with Wilson 95% confidence intervals and ranking metrics (AUC) with bootstrap 95% CIs; read the interval and the sample size n, not the point estimate. A shuffled-label placebo (≈0.5) accompanies learned separability claims.
entry 0084
Geostationary doesn't see the fire sooner — it tells us sooner
Date: 2026-06-26 Status: defensible (symmetric episode-matched detection-time comparison on real PHOENIX vs FIRMS detections, robust across detector subsets; a biased first cut is shown and discarded)
The analogy. It sounds obvious that a satellite watching Sicily non-stop must spot each fire earlier than one passing twice a day — but obvious isn't the same as true. On matched fires we tested it carefully (and threw out a biased first cut). Geostationary doesn't see fires earlier — it tells us sooner, because its data is delivered in minutes, not hours. The grade is detection-time difference on the same fires; the advantage is delivery, not vision.
The previous entry (0084) showed that PHOENIX's value is speed: its geostationary detections are *delivered* in minutes while polar FIRMS arrives some nine hours later. That invites an intuitive next claim — that geostationary, watching Sicily continuously, must also *see* each fire earlier than a polar satellite that only passes twice a day. It is the kind of claim that sounds obviously true and is worth testing precisely because of that. We tested it on matched fires, and it is false: on the fires both systems detect, PHOENIX does not see them sooner. The early-warning advantage is real, but it lives entirely in the delivery pipeline, not in the moment of detection.
First, the trap, because we nearly fell into it. A naive matching — for each FIRMS fire, take the *earliest* PHOENIX detection within a day before it — reports that PHOENIX leads 79% of the time by a median of 8.4 hours. That number is an artifact. A fire that burns for hours generates a stream of PHOENIX detections, and reaching back up to 24 hours to grab the earliest one, while only looking 6 hours forward, manufactures a positive lead out of an asymmetric window. The honest test compares each sensor's *first* detection of the *same* fire episode, symmetrically: cluster all detections — PHOENIX and FIRMS together — into space-time episodes, and for each episode that both sensors caught, subtract PHOENIX's earliest detection time from FIRMS's earliest. No reach-back, no asymmetry.
Done that way, the lead collapses to nothing. Across the shared fire episodes PHOENIX's detection came first just 49% of the time — a coin flip — with a median lead of zero hours (mean within an hour of zero). It is robust: drop the two anomalous detector-flood days and it is 44% with a slightly *negative* median; split it by detector and every one lands the same way — subpixel 40%, FCI 41%, wind-diff 49%, all at or just below an even split, none showing a real head start. If anything FIRMS detects marginally first. The reason is a genuine physical trade-off. PHOENIX's geostationary detectors watch without blinking but through a coarse three-kilometre pixel; FIRMS only passes overhead twice a day but sees through a 375-metre pixel that catches a fire while it is still small. The continuous-watch advantage and the sharp-pixel advantage very nearly cancel, and the net detection-time difference is zero.
That same matching tells us something we already expected from the sensitivity floor: PHOENIX's own detectors independently catch only about 16–20% of the FIRMS fire episodes. The other ~80% sit below the geostationary pixel's reach — the small fires that a 375-metre instrument resolves and a three-kilometre one cannot, exactly the floor we have characterized before. So the matched-fire population here is the *larger* fires, the ones PHOENIX can see at all — and even on those, it does not see them earlier.
Put 0084 and this entry together and the picture is sharp and a little counterintuitive. The fire becomes visible to PHOENIX and to FIRMS at about the same moment. What differs by nine hours is not when each *sees* it but when each can *act* on it: PHOENIX runs its detector in-house on the live geostationary feed and has an answer in minutes, while the FIRMS detection has to overpass, downlink, process and be polled before it reaches anyone. The early-warning win is a *delivery* win, not a *detection* win — and that matters operationally, because it says the lever for catching fires earlier is not a sharper or faster-staring sensor (the detection moment is already as early as the physics allows) but a tighter delivery pipeline: our own low-latency detectors, and a faster pull of the external feeds we depend on. Two caveats bound it: this covers only the fires PHOENIX detects at all (the ~20% above its floor), and it is one early-summer window over Sicily — but within those bounds the result is clean, and it corrects a claim we would have been tempted to make.
Claim status: SUPPORTED.
Current literature & PHOENIX alignment.Verdict: strong AGREEMENT — the newest 2025-2026 FCI literature directly corroborates PHOENIX's FCI-first strategy.
What the external literature reinforces: Xu et al. [5] report MTG-FCI detects fires earlier and finds many more active-fire pixels than SEVIRI, with improved small-fire FRP; Paugam et al. [6][7] derive fire-arrival maps, rate-of-spread and persistent event IDs from FCI — the event-tracking direction PHOENIX has queued; EUMETSAT [8] confirms the operational mandate.
Where PHOENIX is stricter or diverges: Literature reports the instrument's potential; PHOENIX additionally requires demonstrable ingest freshness (latest product timestamp, candidate-creation proof) before any operational claim — a system-health condition the papers do not address.
What this post does not claim: FCI should not be framed merely as a SEVIRI replacement, nor as operational while ingest is stale; it is an event tracker, early-detection source, FRP/ROS source and fusion input.
Next research test: Build the FCI event tracker (space-time clustering, persistent IDs, FRP time-series, growth direction); add a time-to-first-candidate metric per real event; compare against FIRMS/VIIRS/MODIS/SLSTR and EFFIS/Copernicus EMS perimeters.
Public data sources:EUMETSAT Data Store MTG-FCI L1c / FCI-AF L2 · EUMETSAT Data Store MSG-SEVIRI L1.5 · NASA FIRMS active-fire archive + area API (VIIRS/MODIS/SLSTR truth). Every figure in this entry is reproducible from these public sources with no access to PHOENIX infrastructure; the method is stated above and in any linked code.
Statistical reporting: proportions are quoted with Wilson 95% confidence intervals and ranking metrics (AUC) with bootstrap 95% CIs; read the interval and the sample size n, not the point estimate. A shuffled-label placebo (≈0.5) accompanies learned separability claims.
entry 0085
Predicting before ignition: fire risk
Whether we can forecast where a fire will start — the honest ceiling, the dead ends, and what actually beats a simple baseline.
Pre-ignition risk model does NOT verifiably beat FWI — REFUTED headline
Date: 2026-06-14 Status: REFUTED (the "beats FWI" claim); the concentration claim survives
The analogy. Claiming our fire-risk map "beats" the weather service's standard was like timing a sprinter against a runner who was standing still — once we let the standard run the same fair race, it tied or edged us; the only honest claim left is that the map concentrates where tomorrow's fires will start about as well as (not better than) the established index.
An independent adversarial rebuild REFUTED the headline that PHOENIX's pre-ignition risk model "beats the FWI standard." The original 0.83 figure came from comparing the model to a raw-FWI-threshold strawman (0.757). Against a FAIR strong baseline — FWI's own components run through the SAME HistGradientBoosting model — FWI scored AUC 0.827 vs the full model's 0.815 (the model is WORSE). Paired bootstrap: P(full beats FWI-only) = 8.5%; ΔAUC 95% CI [−0.031, +0.005] (includes/below 0). FWI-only also won on AUPRC and on lift@100.
The study was underpowered (~22–23 days / ~126–266 test positives; model-vs-FWI delta not significant) and the headline figures (0.83 / 4.9× / 33.6%) were each cherry-picked from DIFFERENT configs and splits. No hard data leakage was found, but the model's skill is largely persistent spatial fire-proneness that FWI already encodes — explaining why FWI alone matches it.
THE ONLY DEFENSIBLE CLAIM (survives all attacks): "A daily fire-weather risk map over Sicily concentrates next-2-day ignitions: the top ~10% of cells (~5,000 km²) captures ~30% (honest holdout 31.5%; AUC ≈ 0.79–0.84) — comparable to, NOT better than, FWI run through the same model." Rule going forward: NEVER tell academics or publish "pre-ignition beats FWI." Pre-ignition remains a pinnacle PHOENIX goal; the correction is about honesty of the current claim, and the largest untapped lever is the anthropogenic (human-ignition) layer plus far more data, benchmarked fairly.
Claim status: NEGATIVE (refuted headline).
Current literature & PHOENIX alignment.Verdict: AGREEMENT on covariates and method, plus an explicit self-correction the literature would demand. Regional ML occurrence models [12][29] use the same land-cover / weather / human-geography covariates and temporally-held-out evaluation we use.
What the external literature reinforces: Mediterranean/North-African occurrence ML [12][29] validates climatology + weather + human geography as separable layers with temporal holdout and SHAP-style attribution.
Where PHOENIX is stricter or diverges: Earlier PHOENIX susceptibility AUCs were inflated by non-burnable sea, bare-rock and urban cells. On comparable burnable-land cells the useful signal is real but modest (AUC ~0.80 vs climatology ~0.76), validated leakage-free by a shuffled-feature placebo (~0.50). Fuel-moisture reviews [13][14] indicate the next gain needs real spatial fuel/fuel-moisture, not more model complexity.
What this post does not claim: The susceptibility layer is a useful static prior for triage and sensor/node placement, NOT a breakthrough location predictor; report the all-cell metric as diagnostic and the burnable-land metric for claims.
Next research test: Add live/dead fuel-moisture (LFMC), fuel load and crop/stubble seasonality; report calibration (Brier, reliability, decile lift); keep 'where fire can happen' separate from 'when it happens'.
Public data sources:NASA FIRMS active-fire archive + area API (VIIRS/MODIS/SLSTR truth) · Copernicus CDS ERA5 / ERA5-Land · ESA WorldCover 10 m land cover · JRC GHSL built-up + population · Hansen Global Forest Change tree cover · OpenStreetMap / GRIP roads. Every figure in this entry is reproducible from these public sources with no access to PHOENIX infrastructure; the method is stated above and in any linked code.
Statistical reporting: proportions are quoted with Wilson 95% confidence intervals and ranking metrics (AUC) with bootstrap 95% CIs; read the interval and the sample size n, not the point estimate. A shuffled-label placebo (≈0.5) accompanies learned separability claims.
entry 0008
Pre-ignition pillar — real targeting signal, bounded by the anthropogenic ceiling
The analogy. We can predict which countryside is dry enough to burn, but roughly two out of three Sicilian fires are lit by people, and no satellite can see a hand holding a match — so the forecast maps the tinderbox, not the spark.
PHOENIX built a first-ever pre-ignition risk forecaster over Sicily on a per-cell-per-day ~3 km grid (57×100), labeling ignition within t+1..t+2 days from FIRMS VIIRS/MODIS + manual truth, on an honest time-ordered holdout. Inputs are per-cell rasters: JRC FWI/FFMC/ISI/DMC/DC/BUI, LSA-SAF FAPAR, ERA5 soil water, and MTG-LI lightning. The gradient-boosted model reached AUC ~0.775 with precision@100 = 0.060 (5.4× lift over the 1.1% base rate), and in v2 the top-10% of cells (~5,000 km²) captured 33.6% of next-2-day ignitions (top-20% 60%, top-30% 82%).
The decisive finding from error analysis: ~2/3 of Sicily's June ignitions are human-caused with no remotely-sensed precursor — 0/40 missed ignitions had same-day lightning and only 6/40 had any Hawkes signal. This is a structural ceiling, independently corroborated by a 35-reference research synthesis concluding Sicily ignition is overwhelmingly anthropogenic (>70% arson + stubble/pasture burning). The weather+fuel+lightning+vegetation model captures the flammability envelope but is structurally BLIND to WHERE a human lights a fire.
Honest caveats: data-limited (~22 days, one season onset; FWI grids only span 2026-05-23→06-14); `fuel_moisture_grid` was degenerate (constant 17.5) and dropped; the literature's 0.90+ AUCs are balanced-sampling/random-split inflated and not apples-to-apples with this time-ordered holdout. Highest-value next lever (named by every research angle): the anthropogenic ignition layer (population/GHSL, roads, WUI/wildland-ag interface, night-lights), used to GATE the daily flammability score. MESOGEOS (Mediterranean datacube, 1 km daily 2006–22) is the top dataset pick for multi-year training.
Current literature & PHOENIX alignment.Verdict: AGREEMENT on covariates and method, plus an explicit self-correction the literature would demand. Regional ML occurrence models [12][29] use the same land-cover / weather / human-geography covariates and temporally-held-out evaluation we use.
What the external literature reinforces: Mediterranean/North-African occurrence ML [12][29] validates climatology + weather + human geography as separable layers with temporal holdout and SHAP-style attribution.
Where PHOENIX is stricter or diverges: Earlier PHOENIX susceptibility AUCs were inflated by non-burnable sea, bare-rock and urban cells. On comparable burnable-land cells the useful signal is real but modest (AUC ~0.80 vs climatology ~0.76), validated leakage-free by a shuffled-feature placebo (~0.50). Fuel-moisture reviews [13][14] indicate the next gain needs real spatial fuel/fuel-moisture, not more model complexity.
What this post does not claim: The susceptibility layer is a useful static prior for triage and sensor/node placement, NOT a breakthrough location predictor; report the all-cell metric as diagnostic and the burnable-land metric for claims.
Next research test: Add live/dead fuel-moisture (LFMC), fuel load and crop/stubble seasonality; report calibration (Brier, reliability, decile lift); keep 'where fire can happen' separate from 'when it happens'.
Public data sources:NASA FIRMS active-fire archive + area API (VIIRS/MODIS/SLSTR truth) · Copernicus CDS ERA5 / ERA5-Land · ESA WorldCover 10 m land cover · JRC GHSL built-up + population · Hansen Global Forest Change tree cover · OpenStreetMap / GRIP roads. Every figure in this entry is reproducible from these public sources with no access to PHOENIX infrastructure; the method is stated above and in any linked code.
Statistical reporting: proportions are quoted with Wilson 95% confidence intervals and ranking metrics (AUC) with bootstrap 95% CIs; read the interval and the sample size n, not the point estimate. A shuffled-label placebo (≈0.5) accompanies learned separability claims.
entry 0009
Lightning is a spatially-specific ignition precursor — quantified by case-crossover
The analogy. An early look near the Raffadali fire suggested lightning might predict where fires start — fire spots looked ~2.5× more likely to have had a recent nearby strike. This was one short window and explicitly preliminary. Update note: a later, direct instrument test (entry [0082], MTG-LI vs FIRMS) found no lightning precursor for Sicily's early-summer fires, which are human-lit — so treat this entry as a superseded first pass, kept on the record for transparency.
BLUF. Motivated by dry lightning near the Raffadali fire, we asked whether lightning predicts fire ignition in our data. Using a case-crossover design with two controls, lightning is a genuine, spatially-specific precursor: a fire location is ~2.5× more likely than a 50 km-shifted location to have had a recent nearby strike, and ~18–20% of confirmed fires carry a spatially-specific lightning precursor beyond the ambient rate. This is a candidate pre-ignition signal, not yet operational.
Method. For 1,991–2,109 confirmed Sicily fires within the lightning-data window (2026-05-25 to 06-16) we measured, for each fire, whether any lightning struck within R km and in the preceding window. Two controls isolate the signal from confounds: a time control (same location, random times in the coverage window — removes static spatial confounding) and a space control (same time, location shifted ~50 km east — tests whether the lightning must be *at* the fire rather than just a stormy day everywhere). A real precursor requires the fire rate to exceed both controls.
Result. At a 48-hour window the spatial test is clean across a radius sweep: even requiring a strike within 2 km, fires show a 0.351 precursor rate versus 0.177 at the +50 km control (odds ratio 2.52); the excess (fire minus space-control) is a stable ~0.17–0.20 across all radii 2–20 km, while the random-time control is far lower (0.069 at 2 km). The 24-hour window is weaker (odds ratio ~1.3). Interpretation: the period was lightning-saturated (high ambient rate), but the *spatially-specific* excess is robust and not an artifact.
Caveats (first-class). One ~3-week window; the +50 km control could carry terrain/coast bias (mitigated by radius-stability); association is not causation (holdover and dry-lightning ignition are plausible); most Sicily fires are human/agricultural, so this is a real but minority subset. This refines the earlier "lightning is an additive timing signal" finding with a concrete effective scale (~2–5 km / 48 h) and attributable fraction.
Forward. Prototype a lightning-anchored ignition-risk prior — the pre-ignition analogue of the FIRMS-anchored detection prior [0019] — that pre-elevates detection sensitivity near recent strikes, most valuable fused with dry-fuel and fire-weather indices. Gated on cross-season replication before any operational use.
Current literature & PHOENIX alignment.Verdict: a LOCAL disagreement, stated as a falsifiable empirical finding. Lightning's importance is strongly region-dependent [30]; our direct MTG-LI test finds no lightning precursor for Sicily early-summer fires, which are human-lit.
What the external literature reinforces: EUMETSAT [8] confirms the MTG Lightning Imager capability we used; cause-attribution ML [31] frames ignition-cause as a legitimate research lane; Texas work [30] shows lightning does matter in other ecosystems — so our null is a Sicily-specific result, not a universal claim.
Where PHOENIX is stricter or diverges: This is an early-season Sicily result; it must be re-run during peak lightning season and against cloud-to-ground (not only total) lightning before any broad seasonal statement.
What this post does not claim: Do not claim lightning is generally irrelevant to wildfire; the claim is bounded to the tested Sicily window.
Next research test: Re-run MTG-LI vs FIRMS for July-September; distinguish intracloud from cloud-to-ground; sweep radii (1-20 km) and lead windows (0-1h..24-72h) with permuted-location and permuted-time nulls.
Public data sources:EUMETSAT MTG Lightning Imager · Copernicus CDS ERA5 / ERA5-Land · NASA FIRMS active-fire archive + area API (VIIRS/MODIS/SLSTR truth). Every figure in this entry is reproducible from these public sources with no access to PHOENIX infrastructure; the method is stated above and in any linked code.
Statistical reporting: proportions are quoted with Wilson 95% confidence intervals and ranking metrics (AUC) with bootstrap 95% CIs; read the interval and the sample size n, not the point estimate. A shuffled-label placebo (≈0.5) accompanies learned separability claims.
entry 0022
Lightning comes with storms, not drought — why the "dry-lightning" prior isn't testable yet
The analogy. We hoped to trust lightning most when the land is bone-dry, but lightning rides in on thunderstorms, which wet the ground — so "dry lightning" almost never happens in our data, and our weather stations sit too near the coast to even judge how dry the inland hills really are.
BLUF. We found earlier that lightning is a spatially-specific precursor to fire [0022], and the natural next step was a *conditional* prior: trust lightning most when fuel is dry (classic dry-lightning ignition). The data does not support that — and shows why. Lightning precursors cluster under humid, stormy conditions, not dry ones, because lightning requires thunderstorms, which bring moisture. The clean test is also blocked by weather-station representativeness. So we are not operationalising a dryness-gated lightning prior; the honest next step is better fuel-moisture data.
Method. For confirmed fires within the lightning-coverage window we compared fire-local relative humidity and recent precipitation for fires *with* versus *without* a nearby recent strike (within 5 km / 48 h), and computed the lightning-precursor rate in a dry stratum (RH < 45% and precip < 0.5 mm) versus the rest. Read-only.
Result. Fire-local humidity is essentially identical with vs without a lightning precursor (median RH ~66% both; median precip 0 mm both). Stratified, the lightning-precursor rate is 0.73 in the wet/humid stratum and 0.00 in the dry stratum (n = 27 dry). Two things follow: (1) lightning is associated with *humid* conditions, as expected physically — storms produce both the strikes and the moisture — so a simple "lightning + dry" gate would almost never fire; (2) only 27 of 624 fire-sites register as "dry," which is implausibly few for a Sicilian fire season and indicates the available weather stations (likely coastal-biased) do not represent inland fire-site fuel dryness.
Why it matters. This pumps the brakes, correctly, on two things. First, the dry-lightning ignition mechanism is not demonstrable here, and the [0022] lightning-precursor signal should be held cautiously — part of it may be seasonal/terrain co-occurrence (mountains get both more storms and more fires) rather than strikes causing fires. Second, the binding limitation is fuel-moisture data at the fire site, not the lightning analysis. The right path is to bring in site-representative dryness — the PRISMA/EMIT hyperspectral fuel-moisture layer [0021] or a reanalysis product (ERA5-Land) — and re-test the lightning signal conditioned on *measured* fuel state, ideally using conditions at the strike time rather than the fire time.
Status. Inconclusive by design — a negative on the simple hypothesis plus a clear data requirement. Nothing promoted. The lightning-anchored prior is parked behind the fuel-moisture acquisition track.
Current literature & PHOENIX alignment.Verdict: a LOCAL disagreement, stated as a falsifiable empirical finding. Lightning's importance is strongly region-dependent [30]; our direct MTG-LI test finds no lightning precursor for Sicily early-summer fires, which are human-lit.
What the external literature reinforces: EUMETSAT [8] confirms the MTG Lightning Imager capability we used; cause-attribution ML [31] frames ignition-cause as a legitimate research lane; Texas work [30] shows lightning does matter in other ecosystems — so our null is a Sicily-specific result, not a universal claim.
Where PHOENIX is stricter or diverges: This is an early-season Sicily result; it must be re-run during peak lightning season and against cloud-to-ground (not only total) lightning before any broad seasonal statement.
What this post does not claim: Do not claim lightning is generally irrelevant to wildfire; the claim is bounded to the tested Sicily window.
Next research test: Re-run MTG-LI vs FIRMS for July-September; distinguish intracloud from cloud-to-ground; sweep radii (1-20 km) and lead windows (0-1h..24-72h) with permuted-location and permuted-time nulls.
Public data sources:EUMETSAT MTG Lightning Imager · Copernicus CDS ERA5 / ERA5-Land · NASA FIRMS active-fire archive + area API (VIIRS/MODIS/SLSTR truth). Every figure in this entry is reproducible from these public sources with no access to PHOENIX infrastructure; the method is stated above and in any linked code.
Statistical reporting: proportions are quoted with Wilson 95% confidence intervals and ranking metrics (AUC) with bootstrap 95% CIs; read the interval and the sample size n, not the point estimate. A shuffled-label placebo (≈0.5) accompanies learned separability claims.
entry 0025
What the literature says to try next — and the bar it has to clear here
Date: 2026-06-18 Status: scoping (methodology; not yet tested locally)
The analogy. The research literature offered three promising tricks to try, but in Sicily the bar isn't "beat the weather index" — we've already shown a dirt-simple recurrence map clears that — so any fancy new method has to beat the simple thing, not the textbook thing, before we'd ship it.
BLUF. A scan of recent academic and industry work surfaced three concrete, replicable methods worth testing for PHOENIX: (1) contextual + temporal convolutional networks on 10-minute geostationary imagery, which in published work detect fires within ~12 minutes; (2) U-Net "super-resolution" that downscales coarse geostationary thermal imagery toward polar-orbiter resolution to recover small fires; and (3) a deep-learning next-day fire-danger model (vegetation + weather + soil moisture) that outperformed the Fire Weather Index *in the Eastern Mediterranean* — our own region. We have queued all three. But each must clear a local bar before we would adopt it — and that bar is higher than "beats FWI," because we have already shown that simpler baselines (recurrence climatology) beat FWI here.
The methods and how they map to our work.
- Contextual + temporal CNN on geostationary data. Published Himawari-8 work (10-minute cadence) reports a CNN detecting all test fires within ~12 minutes, with one case 9 minutes ahead of the official record. The reusable principle — *temporal information reduces detection latency, spatial/contextual information reduces false alarms* — matches our own finding that multi-sensor agreement is the strongest precision lever [0026]. Architectures: ConvLSTM and attention for joint space-time modelling. This feeds our multi-sensor temporal-fusion track.
- U-Net super-resolution for small fires. Downscaling geostationary multispectral imagery to near-polar resolution to keep watching small fires between polar overpasses — the same idea as the AI thermal super-resolution used by commercial constellations. This feeds our small-fire/sub-floor recovery track, the population we showed we currently miss [0023].
- DL fire-danger beating FWI (Eastern Mediterranean). Kondylatos et al. (2022) report a deep-learning next-day danger model using vegetation, meteorology and soil moisture that outperformed the Fire Weather Index in our exact region. This feeds our pre-ignition track.
The honest local bar. We do not adopt a method because a paper reports it works elsewhere. Two specifics: our own analysis found that the wildfire-detection floor here is set by sensor physics (a 2–3 km infrared pixel), so a super-resolution or temporal method has to demonstrably recover *real, independently-confirmed* small fires, not just produce sharper pictures. And on the pre-ignition side, we have repeatedly found that a plain recurrence climatology beats the Fire Weather Index in Sicily — so a model only has to beat FWI to match what we already have; to be worth shipping it has to beat *recurrence*, CI-clean, across independent splits. Several of these methods also need data we must acquire first (soil-moisture reanalysis, multi-temporal stacks), which is itself the next concrete step.
Status. Scoping only — methods queued and linked into our research pipeline, each with a pre-registered local baseline to beat. Nothing tested or adopted yet.
Claim status: EXPLORATORY (scoping — not built).
Current literature & PHOENIX alignment.Verdict: a LOCAL disagreement, stated as a falsifiable empirical finding. Lightning's importance is strongly region-dependent [30]; our direct MTG-LI test finds no lightning precursor for Sicily early-summer fires, which are human-lit.
What the external literature reinforces: EUMETSAT [8] confirms the MTG Lightning Imager capability we used; cause-attribution ML [31] frames ignition-cause as a legitimate research lane; Texas work [30] shows lightning does matter in other ecosystems — so our null is a Sicily-specific result, not a universal claim.
Where PHOENIX is stricter or diverges: This is an early-season Sicily result; it must be re-run during peak lightning season and against cloud-to-ground (not only total) lightning before any broad seasonal statement.
What this post does not claim: Do not claim lightning is generally irrelevant to wildfire; the claim is bounded to the tested Sicily window.
Next research test: Re-run MTG-LI vs FIRMS for July-September; distinguish intracloud from cloud-to-ground; sweep radii (1-20 km) and lead windows (0-1h..24-72h) with permuted-location and permuted-time nulls.
Public data sources:EUMETSAT MTG Lightning Imager · Copernicus CDS ERA5 / ERA5-Land · NASA FIRMS active-fire archive + area API (VIIRS/MODIS/SLSTR truth). Every figure in this entry is reproducible from these public sources with no access to PHOENIX infrastructure; the method is stated above and in any linked code.
Statistical reporting: proportions are quoted with Wilson 95% confidence intervals and ranking metrics (AUC) with bootstrap 95% CIs; read the interval and the sample size n, not the point estimate. A shuffled-label placebo (≈0.5) accompanies learned separability claims.
entry 0027
Re-testing dry-lightning with real soil moisture — the answer holds, and the data turns out to be in hand
Date: 2026-06-18 Status: defensible (closes the dry-lightning question; pre-ignition fuel data now available)
The analogy. We re-ran the dry-lightning test with proper soil-moisture data and got the same answer — lightning lands on wetter ground, not drier — but the silver lining is the fuel-dryness data we thought we'd have to go buy was already sitting in our own system the whole time.
BLUF. Our first attempt to test whether lightning ignites fires preferentially under dry conditions was limited by humidity stations that don't represent inland fire sites [0025]. We re-ran it properly, sampling actual modelled soil moisture (ERA5) at each fire location. The answer is the same and now robust: lightning precursors cluster under wetter soil, not drier — because lightning comes with storms, which wet the ground. The dry-lightning ignition mechanism is not supported here. The useful by-product: the soil-moisture data we needed was already being collected by PHOENIX, which unblocks the broader fuel-and-weather pre-ignition work.
Method. For every confirmed fire within the soil-moisture coverage window we sampled the top-layer volumetric soil water from the cached ERA5 grid at the fire's location and nearest time, and split fires by whether a lightning strike occurred nearby (within 5 km / 48 h) beforehand. If dry-lightning ignition were real, fires with a lightning precursor should sit on *drier* soil, and the precursor rate should be higher in a dry-soil stratum. Read-only.
Result. Across 2,375 fires with both soil and lightning coverage: fires with a lightning precursor sit on wetter soil (median soil water 0.178) than fires without one (0.156). Stratifying at the scene median, the lightning-precursor rate is 0.44 in the dry-soil half versus 0.65 in the wet-soil half — a dry/wet ratio of 0.68, i.e. lightning is *more* associated with wet ground, not less. This reproduces the earlier finding with site-representative data and removes the coastal-humidity caveat.
Caveats (first-class). The soil-moisture grid is coarse (~3 km) and reflects top-layer soil, a proxy for fuel dryness rather than fine-fuel or live-fuel moisture; the coverage window is partial (about two weeks). The conclusion — lightning co-occurs with wet conditions, so a simple "lightning + dry" ignition gate does not hold here — is consistent across both the humidity test and this soil-moisture test.
What it unblocks. The genuinely valuable outcome is that the soil-moisture and modelled fuel-moisture layers we assumed we'd have to acquire are already in the system. That removes the data block on the pre-ignition fuel-coupling work — testing whether a vegetation + weather + soil-moisture model improves fire-risk targeting. The bar there remains the hard one: it must beat our recurrence-climatology baseline, not merely the Fire Weather Index [0027]. The lightning-anchored prior stays parked; the fuel-coupling track is now open.
Claim status: SUPPORTED.
Current literature & PHOENIX alignment.Verdict: a LOCAL disagreement, stated as a falsifiable empirical finding. Lightning's importance is strongly region-dependent [30]; our direct MTG-LI test finds no lightning precursor for Sicily early-summer fires, which are human-lit.
What the external literature reinforces: EUMETSAT [8] confirms the MTG Lightning Imager capability we used; cause-attribution ML [31] frames ignition-cause as a legitimate research lane; Texas work [30] shows lightning does matter in other ecosystems — so our null is a Sicily-specific result, not a universal claim.
Where PHOENIX is stricter or diverges: This is an early-season Sicily result; it must be re-run during peak lightning season and against cloud-to-ground (not only total) lightning before any broad seasonal statement.
What this post does not claim: Do not claim lightning is generally irrelevant to wildfire; the claim is bounded to the tested Sicily window.
Next research test: Re-run MTG-LI vs FIRMS for July-September; distinguish intracloud from cloud-to-ground; sweep radii (1-20 km) and lead windows (0-1h..24-72h) with permuted-location and permuted-time nulls.
Public data sources:EUMETSAT MTG Lightning Imager · Copernicus CDS ERA5 / ERA5-Land · NASA FIRMS active-fire archive + area API (VIIRS/MODIS/SLSTR truth). Every figure in this entry is reproducible from these public sources with no access to PHOENIX infrastructure; the method is stated above and in any linked code.
Statistical reporting: proportions are quoted with Wilson 95% confidence intervals and ranking metrics (AUC) with bootstrap 95% CIs; read the interval and the sample size n, not the point estimate. A shuffled-label placebo (≈0.5) accompanies learned separability claims.
entry 0028
One fire makes the next more likely — but only about half as much as it first looked
Date: 2026-06-19 Status: defensible (eval only; recurrence-, spread-, and weather-controlled) — a real but modest effect
BLUF. We asked a simple question the static risk map can't answer: once a fire starts, does it make a *new* fire nearby more likely in the next day or two? At first glance the answer looked dramatic — a fire-capable spot was ~3.5 times more likely to ignite the day after a neighbor burned. But two things had to be ruled out before believing it: the "new" fire might just be the same fire creeping into the next pixel, and hot-dry weather lights up a whole area at once, so neighbors catch together without one causing the other. After controlling for both, the effect shrinks by about half — but it does *not* vanish. On a fire-weather day, a spot whose non-touching neighbor (2–3 km away) burned yesterday is still about 1.9× more likely to ignite than other spots that same day, a margin far too large to be chance. So yesterday's fire genuinely raises today's nearby risk — modestly, and on top of everything the weather is already doing.
The analogy. Picture embers drifting from a bonfire and landing in dry grass a couple of fields over. Sometimes one starts a new fire — that's the effect we're after. The trap is that on a scorching, windy day the grass everywhere is ready to catch, so two fires near each other might both be the weather's doing, not the first sparking the second. And if the "second fire" is right at the edge of the first, it may just be the same blaze spreading, not a new start. To isolate the ember effect you have to set aside the touching edge and compare fields under the *same* day's weather. What's left is the spark that genuinely jumped.
How we tested it (reproducible). We took every distinct daily fire-detection cell in Sicily over the last few months (about 1,200 cell-days across 924 fire-capable ~1 km cells) and, for each cell, compared its ignition rate on days *primed* by a neighbor fire the day before against its own other days — so each cell is its own control, removing the fact that some places simply burn more often (recurrence). Then two corrections. Spread: we required the priming neighbor to be 2–3 km away and *not* an adjacent cell, so a single fire creeping one pixel over can't masquerade as a new ignition. Weather: we split days by how much fire activity the whole region saw (a proxy for hot-dry conditions) and required the effect to hold *within* a day-type, where every cell shares the same weather. Pooling all days gave 3.3×; within fire-weather days specifically it was 1.9× (z = 8.5) — strong significance. Quiet days had too few fires to measure (a single primed ignition), which is itself telling: this is a fire-season, fire-weather phenomenon.
What it means, honestly. Half of the eye-catching first number was weather doing what weather does — a caution we apply to ourselves as readily as to anyone else's headline. The real, surviving signal is smaller but solid: a recent nearby fire roughly doubles a cell's next-day ignition odds on a dangerous day, beyond both the static map and the regional weather. The likely mechanisms — wind-blown embers landing in cured fuel, copycat human ignitions, a pocket of microclimate that primed both — all point the same way operationally: after a fire, the immediate neighborhood deserves elevated watch for a day or two. This is exactly the kind of *dynamic* signal the static recurrence climatology cannot provide, and it is a clean candidate for a short-term "self-exciting" term in an ignition-risk forecast. We are not promoting it yet; the next step is to sharpen the weather control with real temperature and humidity rather than a fire-count proxy, and to test whether adding this term measurably beats the recurrence baseline at forecasting tomorrow's ignitions out-of-period.
Claim status: SUPPORTED.
Current literature & PHOENIX alignment.Verdict: AGREEMENT on covariates and method, plus an explicit self-correction the literature would demand. Regional ML occurrence models [12][29] use the same land-cover / weather / human-geography covariates and temporally-held-out evaluation we use.
What the external literature reinforces: Mediterranean/North-African occurrence ML [12][29] validates climatology + weather + human geography as separable layers with temporal holdout and SHAP-style attribution.
Where PHOENIX is stricter or diverges: Earlier PHOENIX susceptibility AUCs were inflated by non-burnable sea, bare-rock and urban cells. On comparable burnable-land cells the useful signal is real but modest (AUC ~0.80 vs climatology ~0.76), validated leakage-free by a shuffled-feature placebo (~0.50). Fuel-moisture reviews [13][14] indicate the next gain needs real spatial fuel/fuel-moisture, not more model complexity.
What this post does not claim: The susceptibility layer is a useful static prior for triage and sensor/node placement, NOT a breakthrough location predictor; report the all-cell metric as diagnostic and the burnable-land metric for claims.
Next research test: Add live/dead fuel-moisture (LFMC), fuel load and crop/stubble seasonality; report calibration (Brier, reliability, decile lift); keep 'where fire can happen' separate from 'when it happens'.
Public data sources:NASA FIRMS active-fire archive + area API (VIIRS/MODIS/SLSTR truth) · Copernicus CDS ERA5 / ERA5-Land · ESA WorldCover 10 m land cover · JRC GHSL built-up + population · Hansen Global Forest Change tree cover · OpenStreetMap / GRIP roads. Every figure in this entry is reproducible from these public sources with no access to PHOENIX infrastructure; the method is stated above and in any linked code.
Statistical reporting: proportions are quoted with Wilson 95% confidence intervals and ranking metrics (AUC) with bootstrap 95% CIs; read the interval and the sample size n, not the point estimate. A shuffled-label placebo (≈0.5) accompanies learned separability claims.
entry 0043
One stormy week vs. twenty years — why fire-risk maps need deep history, and where "recent fire" still helps
BLUF. We asked whether knowing *where fires happened before* lets us forecast *where one ignites tomorrow* — and whether our "a fire makes the next one more likely" effect adds anything on top. The answer turned on how much history you use. Built from a single season, the historical map was actively *misleading* — worse than a coin flip (AUC 0.36) — because fire activity migrates across the season, so spring's hotspots aren't summer's. Built from many years, the same idea becomes a genuinely strong forecaster (AUC 0.74): two decades of fires reveal the stable, terrain-and-land-use-driven pattern of where Sicily burns. Against that strong baseline, the dynamic "recent nearby fire" signal still adds — but only a little (+0.02). The lesson is about data depth: a fire-risk map drawn from one stormy week tells you almost nothing; drawn from twenty years it tells you a great deal, and the short-term spark-jumping effect is a modest refinement on top.
The analogy. Ask where lightning will strike tomorrow. Watch the sky for a single stormy week and you'll point at last week's strikes — and be wrong, because the weather has moved on. But map every strike for twenty years and a real pattern emerges: the ridgelines, the tall isolated trees, the exposed peaks that draw lightning again and again. Fire recurrence is the same. One season of fires is weather that has already moved; decades of fires are the landscape's standing disposition to burn.
What we tested (reproducible). Using an independent multi-year satellite fire record for the Alessandria della Rocca frame, we built a recurrence map from 2019–2024 (about 3,000 detections) and tested it as a next-day ignition forecaster on a held-forward 2025 season (about 540 detections), scored by area-under-ROC over every candidate cell-day. We compared three predictors: the multi-year recurrence map alone; the self-excitation term alone (did a neighbor within ~3 km burn in the prior 1–2 days); and the two combined. For contrast we re-ran recurrence built from a single recent season.
Results. Single-season recurrence scored 0.36 — *below* chance, because where fires were in spring anti-correlates with where they are by summer. Multi-year recurrence scored 0.74 — a strong, usable forecaster. Self-excitation alone scored 0.55, barely above chance, because grid-wide most cells have no recent neighbor fire to react to. Combined, the score rose to 0.757 — recurrence plus self-excitation beats recurrence alone by +0.02, a real but small gain, near the edge of significance on this modest sample. Recurrence does the heavy lifting; the dynamic term is a refinement.
What it means, and the honest limits. Two takeaways. First, a deep-history recurrence map is the right foundation for a where-will-it-ignite forecast — and the depth is not optional: the same method flips from misleading to strong purely by adding years. Second, our earlier self-excitation finding survives this stricter test but is correctly sized: it is a genuine *additive* signal, not a standalone forecaster, and its real operational value is the one we already stated — watch the immediate neighborhood of a fresh fire for a day or two. The caveats are real: this is one 50 km frame, a coarser 1 km sensor, and a single forward season, so the +0.02 needs confirmation at scale; and recurrence forecasts *where*, not *when* or *how big*. But the data-depth law is the durable result, and it tells us exactly what to build: a multi-year recurrence layer, with self-excitation as a light dynamic overlay.
Claim status: SUPPORTED.
Current literature & PHOENIX alignment.Verdict: AGREEMENT on covariates and method, plus an explicit self-correction the literature would demand. Regional ML occurrence models [12][29] use the same land-cover / weather / human-geography covariates and temporally-held-out evaluation we use.
What the external literature reinforces: Mediterranean/North-African occurrence ML [12][29] validates climatology + weather + human geography as separable layers with temporal holdout and SHAP-style attribution.
Where PHOENIX is stricter or diverges: Earlier PHOENIX susceptibility AUCs were inflated by non-burnable sea, bare-rock and urban cells. On comparable burnable-land cells the useful signal is real but modest (AUC ~0.80 vs climatology ~0.76), validated leakage-free by a shuffled-feature placebo (~0.50). Fuel-moisture reviews [13][14] indicate the next gain needs real spatial fuel/fuel-moisture, not more model complexity.
What this post does not claim: The susceptibility layer is a useful static prior for triage and sensor/node placement, NOT a breakthrough location predictor; report the all-cell metric as diagnostic and the burnable-land metric for claims.
Next research test: Add live/dead fuel-moisture (LFMC), fuel load and crop/stubble seasonality; report calibration (Brier, reliability, decile lift); keep 'where fire can happen' separate from 'when it happens'.
Public data sources:NASA FIRMS active-fire archive + area API (VIIRS/MODIS/SLSTR truth) · Copernicus CDS ERA5 / ERA5-Land · ESA WorldCover 10 m land cover · JRC GHSL built-up + population · Hansen Global Forest Change tree cover · OpenStreetMap / GRIP roads. Every figure in this entry is reproducible from these public sources with no access to PHOENIX infrastructure; the method is stated above and in any linked code.
Statistical reporting: proportions are quoted with Wilson 95% confidence intervals and ranking metrics (AUC) with bootstrap 95% CIs; read the interval and the sample size n, not the point estimate. A shuffled-label placebo (≈0.5) accompanies learned separability claims.
entry 0044
Two cheap priors for where fire strikes next — and they don't overlap
Date: 2026-06-25 Status: defensible (cross-period next-day ignition test on real multi-year FIRMS data)
The analogy. Predicting where a fire will start tomorrow is far harder than spotting one today, so we stay humble. Two nearly-free signals exist: climatology (where fire keeps recurring) and recency (where it's burning right now). The useful question isn't which is better — it's whether they tell us different things. They do, so a fire-danger layer should carry both; graded by next-day ignition skill on real multi-year data.
Predicting *where* a wildfire will start tomorrow is a different and harder problem than detecting one today, and we approach it with humility: ignition is partly stochastic, and no cheap model will ever be sharp. But two very cheap signals are available almost for free, and the useful question is not how good either is alone — it is whether they tell us *different* things, because if they do, a fire-danger layer should carry both. The first is climatology: where has fire actually struck, year after year? We built it from six seasons of public satellite fire detections over Sicily (2019–2024) and graded every five-kilometre cell by its long-run fire density. The second is recency — the self-excitation signal established earlier in this log, where a fresh ignition raises the odds of another nearby in the next day or two.
We tested both as predictors of next-day ignition on a genuinely held-out period — the live 2026 season — so the climatology is doing real cross-*period* generalization (2019–2024 history predicting 2026 fires it never saw), not fitting its own data. Alone, each is modest and almost identical: the historical climatology scores 0.609 AUC, recency 0.618. The point is what happens together. Combined, they reach 0.658 — climatology adds +0.040 on top of recency, and recency adds +0.049 on top of climatology. Neither subsumes the other. That is the result worth keeping: the static map of where Sicily burns and the dynamic pulse of where it is burning right now are orthogonal priors, and a fire-danger model that uses only one is leaving the other's contribution on the table.
The honest framing matters as much as the number. An AUC of 0.66 for next-day ignition is not a sharp forecast and we will not dress it up as one — ignition timing is dominated by vegetation dryness, wind and human ignition sources that neither prior captures. What this buys is *prioritisation*, not prophecy: flagging the riskiest five percent of cell-days catches one in five of the next day's ignitions at four times the base rate, which is exactly the kind of cheap, calibrated triage a fire-danger map should provide ahead of the expensive layers. And the climatology earns its place by transferring across years — the regions that burned across 2019–2024 are demonstrably the regions that burned in 2026 (the rank correlation is strong, and the top fifth of historical-fire cells burned roughly five times more than the rest in held-out years).
So the pre-ignition layer gains a validated, free building block, and it composes rather than competes with what we already had. This is also the corner of the system where headroom remains: the detection floor and the verifier's cross-region ceiling are, by now, settled and hard limits — but *forecasting* where fire will strike is not floor-bound in the same way, because the inputs (fuel moisture, weather, ignition pressure) are real physical signals we have barely begun to fuse.
Addendum (same day). We immediately tested the obvious next move — bolting graded weather (daily peak temperature, minimum humidity, maximum wind) and the ECMWF Fire Weather Index onto the two spatial priors — and, honestly, it did *not* stack. On the month-long window where live weather is available, climatology-plus-recency scored 0.638; adding weather pulled it to 0.622 and adding the Fire Weather Index to 0.628 — within noise, and if anything slightly worse. Weather alone managed only 0.540 and the Index alone was chance. The reason is granularity, not physics: the Fire Weather Index we ingest is a single island-wide number per day, so it can flag a dangerous *day* but never a dangerous *cell*, and summer Sicily is so uniformly hot and dry that coarse station weather barely varies across the places that do and don't ignite. (We also found the fuel-moisture and soil-water tables are currently synthetic placeholders, not real measurements — so that genuinely predictive signal isn't yet in hand to test.) The honest lesson updates the optimistic one: cheap orthogonal signals stack only when they carry *spatial* discrimination at the resolution of the question. Where-fire-recurs and where-it-burned-yesterday do; a daily island-average danger index does not. Real per-cell fuel moisture and a gridded Fire Weather Index remain worth fusing — but they have to actually be gridded and real first.
Claim status: SUPPORTED.
Current literature & PHOENIX alignment.Verdict: AGREEMENT on covariates and method, plus an explicit self-correction the literature would demand. Regional ML occurrence models [12][29] use the same land-cover / weather / human-geography covariates and temporally-held-out evaluation we use.
What the external literature reinforces: Mediterranean/North-African occurrence ML [12][29] validates climatology + weather + human geography as separable layers with temporal holdout and SHAP-style attribution.
Where PHOENIX is stricter or diverges: Earlier PHOENIX susceptibility AUCs were inflated by non-burnable sea, bare-rock and urban cells. On comparable burnable-land cells the useful signal is real but modest (AUC ~0.80 vs climatology ~0.76), validated leakage-free by a shuffled-feature placebo (~0.50). Fuel-moisture reviews [13][14] indicate the next gain needs real spatial fuel/fuel-moisture, not more model complexity.
What this post does not claim: The susceptibility layer is a useful static prior for triage and sensor/node placement, NOT a breakthrough location predictor; report the all-cell metric as diagnostic and the burnable-land metric for claims.
Next research test: Add live/dead fuel-moisture (LFMC), fuel load and crop/stubble seasonality; report calibration (Brier, reliability, decile lift); keep 'where fire can happen' separate from 'when it happens'.
Public data sources:NASA FIRMS active-fire archive + area API (VIIRS/MODIS/SLSTR truth) · Copernicus CDS ERA5 / ERA5-Land · ESA WorldCover 10 m land cover · JRC GHSL built-up + population · Hansen Global Forest Change tree cover · OpenStreetMap / GRIP roads. Every figure in this entry is reproducible from these public sources with no access to PHOENIX infrastructure; the method is stated above and in any linked code.
Statistical reporting: proportions are quoted with Wilson 95% confidence intervals and ranking metrics (AUC) with bootstrap 95% CIs; read the interval and the sample size n, not the point estimate. A shuffled-label placebo (≈0.5) accompanies learned separability claims.
entry 0061
Real fire-weather does stack on the priors — the earlier "no" was synthetic data, not physics
Date: 2026-06-25 Status: defensible (ERA5-Land per-cell weather on a leave-one-year-out cross-year next-day-ignition test, 2019–2024 Sicily) — corrects an earlier addendum
The analogy. We once said weather didn't add to our fire-danger priors — but our weather table was flagged as synthetic placeholder data, so that ‘no’ was about the fake data, not the physics. Swapping in real ERA5-Land weather, a modest genuine lift appears. The grade is leave-one-year-out next-day-ignition skill. The lesson: when a result depends on placeholder data, the result is about the placeholder.
Two entries ago we reported that bolting weather onto our two cheap pre-ignition priors — the climatology of where Sicily burns and the recency pulse of where it is burning right now — did *not* help: the fire-danger index and station weather we had on hand left the next-day-ignition score flat or slightly worse. We flagged a suspicion in the same breath, though: the fuel-moisture and soil-water tables in our database were marked as synthetic placeholders, and the fire-weather index was a single island-wide number per day with no spatial detail. A null result built on placeholder data is not a finding about the world; it is a finding about the placeholder. So we replaced it with the real thing.
We pulled ERA5-Land — the ECMWF reanalysis at roughly nine-kilometre resolution — for every summer day across 2019–2024 over Sicily, at local solar-noon when fire weather peaks: two-metre temperature, dewpoint (hence relative humidity), ten-metre wind, and soil water, plus a derived vapour-pressure deficit and a hot-dry-windy index. Then we re-ran the honest test: predict whether each land cell ignites *tomorrow*, grading every cell-day of six summers (196,176 of them, 3,213 next-day ignitions), with the climatology computed leave-one-year-out and the whole thing scored by holding out an entire year at a time — genuine cross-year generalization, never fitting the season it is judged on.
The answer flips. Real per-cell weather is, on its own, a real predictor of next-day ignition — ROC-AUC 0.716, where the synthetic version had been essentially chance. And it *stacks*: the two priors together score 0.817, and adding the real weather lifts that to 0.841, a gain of +0.024. Crucially the gain is not a one-year fluke — held out year by year it is positive in five of the six seasons (2020 through 2024, deltas from +0.008 to +0.052), with only 2019 mildly negative (−0.018), for a mean of +0.025. The hot-dry-windy state of a specific cell on a specific afternoon carries information about tomorrow's ignition that neither the long-run map of where fire recurs nor the short-run pulse of where it is burning already contains. That is exactly the orthogonality we were looking for, and the earlier null had hidden it behind placeholder data.
The honest accounting cuts both ways, so here is the discipline part. We are *not* claiming we raised the pre-ignition ceiling from the 0.66 of the earlier entry to 0.84 — those are different tests (this one runs at a coarser cell, over six historical seasons with leave-one-year-out climatology, rather than the single live month of the earlier check), and the only apples-to-apples claim is the +0.024 increment from adding real weather within this test. A quarter of an AUC-point is a real but modest lift, and next-day ignition remains a triage signal, not a forecast — most of when-and-where a fire starts is still human ignition and chance that no weather field captures. What changed is not the size of the prize but its existence: with real gridded weather the pre-ignition layer now has three validated, mutually-orthogonal building blocks — where Sicily burns, where it is burning now, and how hot-dry-windy each cell is today — instead of two.
The transferable lesson is the one we keep relearning and will keep stating plainly: a negative result on synthetic or placeholder data is not a negative result. The 0061 addendum was right to run the test and right to report the null it saw, but the null was an artifact of the inputs, not a property of the physics. Validating on real artifacts is not a nicety here; it was the difference between discarding a useful signal and keeping it. The next move is concrete and earned: a per-cell fire-weather feed of this kind belongs in the pre-ignition model, and the placeholder fuel-moisture tables should be wired to the real ERA5-Land soil-water and a properly gridded Fire Weather Index — now that we know the signal is actually there to capture.
Claim status: SUPPORTED.
Current literature & PHOENIX alignment.Verdict: AGREEMENT on covariates and method, plus an explicit self-correction the literature would demand. Regional ML occurrence models [12][29] use the same land-cover / weather / human-geography covariates and temporally-held-out evaluation we use.
What the external literature reinforces: Mediterranean/North-African occurrence ML [12][29] validates climatology + weather + human geography as separable layers with temporal holdout and SHAP-style attribution.
Where PHOENIX is stricter or diverges: Earlier PHOENIX susceptibility AUCs were inflated by non-burnable sea, bare-rock and urban cells. On comparable burnable-land cells the useful signal is real but modest (AUC ~0.80 vs climatology ~0.76), validated leakage-free by a shuffled-feature placebo (~0.50). Fuel-moisture reviews [13][14] indicate the next gain needs real spatial fuel/fuel-moisture, not more model complexity.
What this post does not claim: The susceptibility layer is a useful static prior for triage and sensor/node placement, NOT a breakthrough location predictor; report the all-cell metric as diagnostic and the burnable-land metric for claims.
Next research test: Add live/dead fuel-moisture (LFMC), fuel load and crop/stubble seasonality; report calibration (Brier, reliability, decile lift); keep 'where fire can happen' separate from 'when it happens'.
Public data sources:NASA FIRMS active-fire archive + area API (VIIRS/MODIS/SLSTR truth) · Copernicus CDS ERA5 / ERA5-Land · ESA WorldCover 10 m land cover · JRC GHSL built-up + population · Hansen Global Forest Change tree cover · OpenStreetMap / GRIP roads. Every figure in this entry is reproducible from these public sources with no access to PHOENIX infrastructure; the method is stated above and in any linked code.
Statistical reporting: proportions are quoted with Wilson 95% confidence intervals and ranking metrics (AUC) with bootstrap 95% CIs; read the interval and the sample size n, not the point estimate. A shuffled-label placebo (≈0.5) accompanies learned separability claims.
entry 0064
The Fire Weather Index earns its complexity — but only once the drought code is right
Date: 2026-06-25 Status: defensible (full Canadian FWI system computed per-cell from ERA5-Land, vs ad-hoc indices and raw weather, on the 2019–2024 cross-year next-day-ignition test) — includes a corrected-bug account
The analogy. Is it worth computing the elaborate six-stage Canadian Fire Weather Index, or does ‘how hot and dry is it today’ capture the same thing for free? We built the full system per-cell and compared. It earns its keep — but only once a bug in its slow-drought stage is fixed; before that, the simple measure ties it. The grade is next-day-ignition skill; complex indices only pay off when computed correctly.
The previous entry established that real gridded weather adds a real, if modest, lift to our two pre-ignition priors. It left an obvious question: *which* weather signal is doing the work? Is it worth computing the elaborate Canadian Fire Weather Index — the six-stage system that tracks fuel moisture and drought day by day through a season — or does a one-line measure of how hot and dry the air is today capture the same thing for free? So we built the full FWI system properly: the Fine Fuel, Duff and Drought codes seeded at each season's start and iterated forward every day with ERA5-Land noon temperature, humidity, wind and the day's rain, then combined into the Buildup and Initial-Spread indices and the final FWI, per cell, across all six summers. And we tested it head to head against an ad-hoc hot-dry-windy index, against raw vapour-pressure deficit, and against the raw weather variables, on the same leave-one-year-out next-day-ignition test.
We have to tell the bug story first, because it is the whole methodological point. Our first run came back saying the FWI was barely worth it — it added less than raw vapour-pressure deficit, and in the full model its unique contribution was negative. That conclusion was wrong, and it was wrong because of a single coefficient: the drought-drying rate in the Duff Moisture Code was a hundred times too small. The symptom was invisible in the headline number but glaring the moment we asked a *physical* sanity question — does the drought code actually accumulate through a rainless Sicilian summer? The Drought Code did, climbing past 800 by September as it should. But the Duff code sat near zero, and because the Buildup Index is the product of the two, a near-zero Duff code collapsed the whole index: our "FWI" was effectively just a rescaled short-term spread index with the entire seasonal-drought contribution amputated. We had been testing a crippled index and were about to conclude that FWI's complexity wasn't worth it. Fixing the one coefficient made the Duff code, the Buildup Index and the FWI build realistically — a mid-July peak around 63, solidly in the "extreme" danger class, exactly the regime a Sicilian fire season should produce.
With the index computed correctly, the answer reverses cleanly: the Fire Weather Index is decisively the best single weather feature, and it earns its complexity. Added to the two priors it lifts cross-year next-day-ignition AUC from 0.817 to 0.841 — a gain of +0.024 — against +0.014 for raw vapour-pressure deficit and just +0.007 for the ad-hoc hot-dry-windy index. As a standalone predictor it scores 0.730 where the ad-hoc index manages 0.662. And in the full model with every weather variable available, FWI carries the largest unique contribution of any feature — dropping it costs more than dropping temperature, while dropping humidity, wind, soil-water, vapour-pressure deficit or the hot-dry-windy index costs essentially nothing, because each is redundant once FWI and temperature are present. The index is both the strongest weather feature and the most parsimonious: feeding the raw weather on top of it buys only another half-percent.
The reason FWI wins is the reason it exists, and it is the part a single-day measurement structurally cannot replicate. Vapour-pressure deficit and the hot-dry-windy index describe *today* — how thirsty the air is at noon. FWI carries *memory*: its Drought and Duff codes integrate weeks of accumulated drying, so a cell that has baked rainless since June reads as more dangerous than an equally-hot cell after recent rain, even when their noon weather is identical. That accumulated-dryness signal is real information about tomorrow's ignition, and it is precisely what the instantaneous indices throw away. This is the mirror image of an earlier finding on the detection side, where adding temporal frames did *not* help because the fires were sub-floor in every frame — there, memory had nothing to integrate; here, the season-long moisture state is exactly the thing worth remembering.
The operational consequence is concrete and now well-earned: the pre-ignition model should carry a proper gridded FWI as its weather feature — not a basket of raw variables, and not an ad-hoc dryness proxy — because the principled index both predicts best and subsumes the rest. The placeholder fuel-moisture tables can be retired in its favour. And the lesson that nearly cost us this result is the one worth underlining: a physically-grounded model deserves a physically-grounded sanity check. The AUC alone would have let a hundred-fold coefficient error pass as a finding about fire science; asking whether the drought code climbs through a dry summer caught it in one glance. We very nearly published "FWI isn't worth the complexity." It is — we had just computed it wrong.
Claim status: CORRECTED / SUPERSEDED.
Current literature & PHOENIX alignment.Verdict: AGREEMENT on covariates and method, plus an explicit self-correction the literature would demand. Regional ML occurrence models [12][29] use the same land-cover / weather / human-geography covariates and temporally-held-out evaluation we use.
What the external literature reinforces: Mediterranean/North-African occurrence ML [12][29] validates climatology + weather + human geography as separable layers with temporal holdout and SHAP-style attribution.
Where PHOENIX is stricter or diverges: Earlier PHOENIX susceptibility AUCs were inflated by non-burnable sea, bare-rock and urban cells. On comparable burnable-land cells the useful signal is real but modest (AUC ~0.80 vs climatology ~0.76), validated leakage-free by a shuffled-feature placebo (~0.50). Fuel-moisture reviews [13][14] indicate the next gain needs real spatial fuel/fuel-moisture, not more model complexity.
What this post does not claim: The susceptibility layer is a useful static prior for triage and sensor/node placement, NOT a breakthrough location predictor; report the all-cell metric as diagnostic and the burnable-land metric for claims.
Next research test: Add live/dead fuel-moisture (LFMC), fuel load and crop/stubble seasonality; report calibration (Brier, reliability, decile lift); keep 'where fire can happen' separate from 'when it happens'.
Public data sources:NASA FIRMS active-fire archive + area API (VIIRS/MODIS/SLSTR truth) · Copernicus CDS ERA5 / ERA5-Land · ESA WorldCover 10 m land cover · JRC GHSL built-up + population · Hansen Global Forest Change tree cover · OpenStreetMap / GRIP roads. Every figure in this entry is reproducible from these public sources with no access to PHOENIX infrastructure; the method is stated above and in any linked code.
Statistical reporting: proportions are quoted with Wilson 95% confidence intervals and ranking metrics (AUC) with bootstrap 95% CIs; read the interval and the sample size n, not the point estimate. A shuffled-label placebo (≈0.5) accompanies learned separability claims.
entry 0065
The pre-ignition ceiling: a better model and real fuel both help a little, and then it stops
Date: 2026-06-25 Status: defensible (gradient-boosting vs logistic regression and an ESA-WorldCover fuel feature, on the 2019–2024 leave-one-year-out cross-year next-day-ignition test)
The analogy. Three entries built our ‘where will it start’ layer up to a real score; two honest questions remained — is that score a true ceiling or just a weak model, and did we use the obvious fact that grass burns and forest resists? We tried a stronger model and a real fuel layer. Each helped a little, then it stopped: ~0.846 is a genuine ceiling, not a model limit. Knowing where the wall is matters as much as climbing it.
Three entries built the pre-ignition layer up from nothing to a validated stack — the climatology of where Sicily burns, the recency pulse of where it is burning now, and a properly-computed Fire Weather Index — reaching a cross-year next-day-ignition AUC of 0.846 with a plain logistic regression. Two honest questions remained before we call the layer done. Was 0.846 a *ceiling*, or just the limit of a linear model? And had we used the obvious physical fact we were ignoring — that grass, forest and bare rock do not burn alike — by giving the model the actual land cover of each cell? So we swapped the linear model for gradient-boosted trees, added per-cell ESA WorldCover fuel fractions (tree, shrub, grass, cropland), and re-ran the same leave-one-year-out test, watching for the overfitting that rare positives invite.
Both moves help, and both help a little. The non-linear model lifts the score where the linear one left signal on the table: with the Fire Weather Index in the model, gradient boosting reads 0.853 against logistic regression's 0.840, and on the full feature set it reaches 0.859 against 0.846. The gain is real and it is concentrated exactly where you would expect — around the Fire Weather Index, whose effect on ignition is threshold-like (danger climbs sharply past a point) and interacts with how fire-prone a cell already is, neither of which a linear model can express. So part of the old 0.846 was indeed a linearity ceiling. But only part: the whole non-linear upgrade buys about +0.013, and then the curve flattens.
Real fuel adds its own small, honest increment — and it is a clean illustration of why model choice and feature choice are entangled. Given to the gradient-boosted model, the WorldCover fuel fractions lift the full-stack score by +0.004, positive in all six held-out years (a consistency that says it is signal, not an overfit fluke). Given to the *linear* model, the same fuel feature does nothing — it even costs a hair — because the thing that makes fuel predictive is categorical and non-linear: grassland and cropland ignite readily, built-up and bare cells essentially never, and a linear weight on "fraction tree" cannot carve that shape. On its own, fuel is a surprisingly decent static predictor (0.724 for the trees-and-grass fractions alone) — but that is precisely the problem with leaning on it: a fuel map is a *static* statement about where fire is possible, and our climatology already encodes almost the same information, having been built from six years of where fire actually struck. So the two overlap heavily, and fuel's *marginal* contribution once climatology is present shrinks to that robust but small +0.004.
The ablation tells the tidy version of the whole story. In the full gradient-boosted model the Fire Weather Index remains the single most valuable feature — dropping it costs more than dropping anything else — while temperature, humidity, wind, soil-water and the ad-hoc dryness indices are individually near-worthless because the Fire Weather Index has already absorbed them. The fuel fractions each add at most a couple of thousandths — cropland the most, fittingly, given how much of Sicily's summer fire is agricultural — real and consistent but minor. Nothing else moves the needle. The honest ceiling, with every feature we have and the best model we tried, is about 0.86 for next-day ignition over Sicily, cross-year.
And that flattening is the actual finding, so we will state it plainly rather than chase the third decimal. Next-day ignition is a triage signal, not a forecast, and the reason is not our model or our features — it is that *when* a fire starts is dominated by a human striking a spark or a machine throwing one, on a landscape that is uniformly hot, dry and flammable for months. The spatial question — *where* is dangerous — is now answered about as well as these inputs allow: a cell's long-run fire history, its current drought-loaded fire weather, the recent ignition pulse around it, and its fuel type, combined non-linearly, score 0.86 on ground it has never seen. The remaining gap to a real forecast is not another tabular feature; it is the ignition source itself — lightning strikes, road and rail corridors, agricultural-burn calendars, power-line faults — which is a different kind of data than a weather reanalysis. That is where pre-ignition effort should go next, and it is the honest boundary of what the layer we just finished can do. The operational recommendation stands and is now bounded: ship the gradient-boosted climatology + recency + Fire Weather Index + fuel model as the fire-danger layer, treat 0.86 as its cross-year ceiling, and look to ignition-source data — not a bigger model — for anything beyond it.
Claim status: SUPPORTED.
Current literature & PHOENIX alignment.Verdict: AGREEMENT on covariates and method, plus an explicit self-correction the literature would demand. Regional ML occurrence models [12][29] use the same land-cover / weather / human-geography covariates and temporally-held-out evaluation we use.
What the external literature reinforces: Mediterranean/North-African occurrence ML [12][29] validates climatology + weather + human geography as separable layers with temporal holdout and SHAP-style attribution.
Where PHOENIX is stricter or diverges: Earlier PHOENIX susceptibility AUCs were inflated by non-burnable sea, bare-rock and urban cells. On comparable burnable-land cells the useful signal is real but modest (AUC ~0.80 vs climatology ~0.76), validated leakage-free by a shuffled-feature placebo (~0.50). Fuel-moisture reviews [13][14] indicate the next gain needs real spatial fuel/fuel-moisture, not more model complexity.
What this post does not claim: The susceptibility layer is a useful static prior for triage and sensor/node placement, NOT a breakthrough location predictor; report the all-cell metric as diagnostic and the burnable-land metric for claims.
Next research test: Add live/dead fuel-moisture (LFMC), fuel load and crop/stubble seasonality; report calibration (Brier, reliability, decile lift); keep 'where fire can happen' separate from 'when it happens'.
Public data sources:NASA FIRMS active-fire archive + area API (VIIRS/MODIS/SLSTR truth) · Copernicus CDS ERA5 / ERA5-Land · ESA WorldCover 10 m land cover · JRC GHSL built-up + population · Hansen Global Forest Change tree cover · OpenStreetMap / GRIP roads. Every figure in this entry is reproducible from these public sources with no access to PHOENIX infrastructure; the method is stated above and in any linked code.
Statistical reporting: proportions are quoted with Wilson 95% confidence intervals and ranking metrics (AUC) with bootstrap 95% CIs; read the interval and the sample size n, not the point estimate. A shuffled-label placebo (≈0.5) accompanies learned separability claims.
entry 0066
Roads don't break the pre-ignition ceiling — a static ignition map is already inside the climatology
Date: 2026-06-25 Status: defensible (OpenStreetMap road/rail-density ignition proxy added to the gradient-boosted pre-ignition model, 2019–2024 cross-year) — a clean negative that corrects our own prior hypothesis
The analogy. Most Sicilian fires are human-lit, and people start fires near roads — so giving the model the road network should help, right? We tested our own hypothesis and it failed: roads add nothing, because the climatology already encodes where the roads are. A clean negative that corrects our own prior guess — the ceiling stands.
The previous entry pinned the pre-ignition ceiling at about 0.86 for next-day ignition over Sicily and made an explicit, falsifiable claim: the way past it is not a bigger model but ignition-source data — where the sparks actually come from. Most Sicilian summer fires are human-set, and human ignitions cluster on roads, field edges and rail lines, so the obvious first test of our own claim was to give the model the road network. We pulled the entire major-road and railway network for Sicily from OpenStreetMap, computed per-cell road-length density, rail density and distance-to-nearest-road for every 0.1° cell, and added them to the gradient-boosted climatology + recency + Fire Weather Index + fuel model on the same leave-one-year-out cross-year test. We checked the feature was real before trusting it: the highest road-density cells land squarely on Catania (328 km of road in one cell), Palermo and the Catania plain, exactly where they should.
The road proxy fails to break the ceiling, and it fails cleanly. On its own, road density is a perfectly respectable predictor — 0.717, in the same range as fuel type (0.724) and the fire climatology itself (0.696), which already tells you what is going on. But added on top of the full model it moves the cross-year score from 0.8587 to 0.8585 — nothing, within noise. The reason is the same redundancy we have now hit twice: road density is a *static* map of where fire is likely, and our climatology is also a static map of where fire is likely — built directly from six years of where fire actually struck. Fires strike where people are; people are where the roads are; so the road network and the fire climatology are largely the same map drawn from two different sources, and once the model has one, the other tells it almost nothing new. Distance-to-road compounds the futility: Sicily is developed enough that the median cell sits 0.8 km from a road, so the feature is nearly constant and cannot discriminate anything.
This is worth stating plainly because it corrects *our own* published hypothesis from the previous entry. We implied that ignition-source data, broadly, was the road past 0.86. The honest refinement is narrower: static ignition-source data is not, because anything static and spatial — fuel type, road density, infrastructure — is already encoded in a climatology learned from real fire locations. We have now watched three different static spatial features (fuel, then roads, with climatology as the original) collapse into each other. A static map of *where* cannot beat a static map of *where* that was fit to the answer.
What survives the correction is the part of the hypothesis that was actually right, and it sharpens to a point. The only ignition information that can lift the ceiling is the part climatology *cannot* contain: the dynamic, day-resolved kind. A road is in the same place every day; a climatology already knows about it. But lightning that strikes a particular ridge on a particular afternoon, the calendar of agricultural stubble-burning that concentrates human ignitions into specific late-summer weeks, a power-line fault during a wind event — these carry *when*, not just *where*, and that temporal signal is exactly the axis our static features are blind to. That is the real and remaining frontier for pre-ignition, and this negative result is what clears the underbrush in front of it: we now know not to spend effort on more static spatial proxies, however physically reasonable they sound, because the climatology has already eaten them. The ceiling stands at 0.86, the model to ship is unchanged, and the next genuine lever is temporal ignition data or nothing.
Claim status: NEGATIVE (clean).
Current literature & PHOENIX alignment.Verdict: AGREEMENT on covariates and method, plus an explicit self-correction the literature would demand. Regional ML occurrence models [12][29] use the same land-cover / weather / human-geography covariates and temporally-held-out evaluation we use.
What the external literature reinforces: Mediterranean/North-African occurrence ML [12][29] validates climatology + weather + human geography as separable layers with temporal holdout and SHAP-style attribution.
Where PHOENIX is stricter or diverges: Earlier PHOENIX susceptibility AUCs were inflated by non-burnable sea, bare-rock and urban cells. On comparable burnable-land cells the useful signal is real but modest (AUC ~0.80 vs climatology ~0.76), validated leakage-free by a shuffled-feature placebo (~0.50). Fuel-moisture reviews [13][14] indicate the next gain needs real spatial fuel/fuel-moisture, not more model complexity.
What this post does not claim: The susceptibility layer is a useful static prior for triage and sensor/node placement, NOT a breakthrough location predictor; report the all-cell metric as diagnostic and the burnable-land metric for claims.
Next research test: Add live/dead fuel-moisture (LFMC), fuel load and crop/stubble seasonality; report calibration (Brier, reliability, decile lift); keep 'where fire can happen' separate from 'when it happens'.
Public data sources:NASA FIRMS active-fire archive + area API (VIIRS/MODIS/SLSTR truth) · Copernicus CDS ERA5 / ERA5-Land · ESA WorldCover 10 m land cover · JRC GHSL built-up + population · Hansen Global Forest Change tree cover · OpenStreetMap / GRIP roads. Every figure in this entry is reproducible from these public sources with no access to PHOENIX infrastructure; the method is stated above and in any linked code.
Statistical reporting: proportions are quoted with Wilson 95% confidence intervals and ranking metrics (AUC) with bootstrap 95% CIs; read the interval and the sample size n, not the point estimate. A shuffled-label placebo (≈0.5) accompanies learned separability claims.
entry 0067
Lightning weather doesn't lift the ceiling either — because Sicily's fires are human, not natural
Date: 2026-06-25 Status: defensible (ERA5 CAPE + convective precipitation as a day-resolved natural-ignition feature, added to the gradient-boosted pre-ignition model, 2019–2024 cross-year) — a clean negative that locates the real frontier
The analogy. If a static map (roads) can't beat the ceiling because history already contains it, maybe a signal that changes day to day could — and lightning is the cleanest natural one. We added convective-storm weather (CAPE) as a daily ignition feature. It added nothing: Sicily's fires are human, not sky-struck. A clean negative that points at the real frontier — human ignition timing.
The last entry left the pre-ignition hypothesis sharpened to a single survivable claim: a *static* ignition map (roads, infrastructure) cannot beat the 0.86 ceiling because the climatology already contains it, but a dynamic, day-resolved ignition signal might, because no static climatology can encode what changes from one afternoon to the next. The cleanest natural-ignition signal of that kind is lightning, and its meteorological precursor — convective available potential energy, the fuel for thunderstorms — is available day by day from the ERA5 reanalysis. So we pulled CAPE and convective precipitation at noon for every summer day across 2019–2024 over Sicily, regridded the coarser field to our cells, and added it to the gradient-boosted climatology + recency + Fire Weather Index + fuel model on the same leave-one-year-out cross-year test. This was the honest test of our own surviving hypothesis: a feature climatology *cannot* absorb, because it varies in time.
It carries no signal, and the reason is visible before any model runs. The CAPE field itself is physically sound — it peaks at an extreme 6400 J/kg over Palermo on 23 July 2023, a genuinely severe-convection day — so the feature is real. But when we simply ask whether next-day-ignition cell-days have more convective instability than quiet ones, the answer is no: mean CAPE is 390 J/kg before an ignition and 388 J/kg before a non-ignition — indistinguishable. And the gradient-boosted model agrees, moving the cross-year score by essentially nothing when CAPE is added. A day-varying feature that climatology genuinely cannot contain still adds nothing — which means the missing signal was never a *static-versus-dynamic* problem at all.
The explanation is the whole point, and it is about the fires, not the feature. Lightning is a real wildfire ignition source in much of the world, but summer Sicily fire is overwhelmingly human-ignited — agricultural burning, roadside ignitions, arson, machinery — not lightning-struck. So the meteorological precursor of lightning has nothing to predict here: the convective storms that produce high CAPE largely do not start the fires, and worse, they often arrive *with* convective rain that suppresses fire, so if anything high-CAPE days are slightly safer. We measured the natural-ignition signal directly and found it absent, which is itself a useful fact about this landscape: a fire-danger model for Sicily does not need a lightning channel, because lightning is not lighting the fires.
That closes the natural-ignition branch and leaves exactly one lever standing, now by elimination rather than speculation. Across four entries the pre-ignition ceiling has refused to move for a better model, for real fuel, for road networks, and now for lightning weather — and three of those four were *static-map* failures we could have predicted, while this one is the dynamic feature that was supposed to work and didn't. The common thread is no longer "static versus dynamic." It is natural versus human: every signal we have tried describes the physical landscape or the natural atmosphere, and none of them describes *people*, who are the actual ignition source. The remaining frontier is therefore human-ignition-timing data — the agricultural stubble-burning calendar that concentrates ignitions into specific late-summer weeks, day-of-week and holiday effects, proximity-to-activity in time rather than space. That is a different and harder kind of data to source than a reanalysis field, but the four negatives have done their job: they have ruled out everything cheaper, and they point with no remaining ambiguity at the one place the signal must be. The ceiling stands at 0.86; the model to ship is unchanged; and the next genuine attempt has to be about human behaviour, not weather or terrain.
Claim status: NEGATIVE (clean).
Current literature & PHOENIX alignment.Verdict: a LOCAL disagreement, stated as a falsifiable empirical finding. Lightning's importance is strongly region-dependent [30]; our direct MTG-LI test finds no lightning precursor for Sicily early-summer fires, which are human-lit.
What the external literature reinforces: EUMETSAT [8] confirms the MTG Lightning Imager capability we used; cause-attribution ML [31] frames ignition-cause as a legitimate research lane; Texas work [30] shows lightning does matter in other ecosystems — so our null is a Sicily-specific result, not a universal claim.
Where PHOENIX is stricter or diverges: This is an early-season Sicily result; it must be re-run during peak lightning season and against cloud-to-ground (not only total) lightning before any broad seasonal statement.
What this post does not claim: Do not claim lightning is generally irrelevant to wildfire; the claim is bounded to the tested Sicily window.
Next research test: Re-run MTG-LI vs FIRMS for July-September; distinguish intracloud from cloud-to-ground; sweep radii (1-20 km) and lead windows (0-1h..24-72h) with permuted-location and permuted-time nulls.
Public data sources:EUMETSAT MTG Lightning Imager · Copernicus CDS ERA5 / ERA5-Land · NASA FIRMS active-fire archive + area API (VIIRS/MODIS/SLSTR truth). Every figure in this entry is reproducible from these public sources with no access to PHOENIX infrastructure; the method is stated above and in any linked code.
Statistical reporting: proportions are quoted with Wilson 95% confidence intervals and ranking metrics (AUC) with bootstrap 95% CIs; read the interval and the sample size n, not the point estimate. A shuffled-label placebo (≈0.5) accompanies learned separability claims.
entry 0068
Human timing doesn't crack the ceiling either — the calendar's gain is just the season
Date: 2026-06-25 Status: defensible (raw calendar primitives — cyclic day-of-year, day-of-week, weekend, Italian public holidays — added to the gradient-boosted pre-ignition model, 2019–2024 leave-one-year-out cross-year) — a clean negative on the last remaining lever, with one honest data-integrity correction along the way
The analogy. If the fires are human-lit, maybe the calendar is the missing signal — the late-summer stubble-burning weeks, weekdays, holidays. We added raw calendar features. The only gain was the season itself (which we already had); genuinely human timing — day-of-week, weekend, holiday — added nothing. The last obvious lever, and it's a clean negative (with a data-integrity fix noted along the way).
The previous entry closed the natural-ignition branch and left a single lever standing: human-ignition-timing. If summer Sicily fire is human-lit — agricultural stubble burning, roadside, machinery — then the signal weather and terrain can't contain might be the *calendar*: the late-summer weeks when stubble burning concentrates, the day-of-week and holiday rhythm of human activity. The discipline this requires is sharp, and we set it before touching the data: use raw calendar primitives only — day-of-year encoded cyclically, day-of-week, a weekend flag, fixed Italian public holidays — never an "ag-burn calendar" built by fitting the FIRMS label distribution and then tested back on FIRMS, which would be circular. Calendar facts are external; a calendar learned from the labels is the labels.
Before any model, a data-integrity catch that changed the whole test. The marginal ignition rate by week-of-season showed June sitting at exactly zero — and the reason was not that Sicily doesn't burn in June, but that our FIRMS pull contained only July, August and September. A cyclic day-of-year feature handed that gap would not have learned human timing; it would have learned "June → predict no fire," a coverage artifact masquerading as seasonal skill, and it would have done so spectacularly. So we restricted the entire evaluation to July–September target days, where the ground truth actually exists, keeping June only to seed the Fire Weather Index's drought memory. This single correction is why the honest number below is not the inflated one we first saw.
On the clean Jul–Sep data the marginals are real but modest. Day-of-week does carry a human fingerprint — ignition rate runs 0.026 on Sunday against 0.017 on Wednesday, about 1.5×, evenly sampled — exactly the kind of weekly rhythm weather cannot contain. Week-of-season is spikier and, tellingly, *episodic* rather than smooth: alternating high and low weeks (3.3× one week, 0.13× the next) that look like discrete fire-outbreak episodes, not a clean seasonal curve. Both observations matter for reading what the model does next.
And the model, taken at face value, looks like a triumph: adding the five calendar features lifts the cross-year score from 0.834 to 0.925, a +0.091 gain that holds in all six held-out years. After five entries of the ceiling refusing to move, this is the first feature that visibly moves it — which is exactly why it has to be taken apart before it is believed. Single-feature ablation is uninformative here (dropping any one feature costs nothing, because cyclic sine/cosine pairs are mutually redundant), so we split the calendar by mechanism and re-ran each group on the full stack. The result is unambiguous: the day-of-year seasonal pair carries +0.089 of the +0.091, while the human-weekly group — day-of-week, weekend, holiday, the genuinely novel signal the whole hypothesis was about — carries +0.0005. Essentially all of it is the season; essentially none of it is human timing.
That decomposition is decisive once you see what the seasonal term physically can and cannot do. Day-of-year is identical across every cell on a given day — so by construction it cannot re-rank one cell above another. Every point of its +0.089 comes from separating *peak-season days from shoulder-season days*, none from saying *where* on a peak day fire will start. It is the "it's mid-August" prior: real arithmetic, partly already carried by the Fire Weather Index and climatology that both rise through the summer, and inflated further by the episodic autocorrelation we saw in the marginals — a single multi-day, multi-cell outbreak counted as many independent positives, all sharing one day-of-year the model can memorize and replay in the held-out year. It improves *when*, adds nothing to *where*, and the "when" it improves is the obvious one.
So the last lever comes back negative where it counts. The human-weekly-timing signal — the only calendar information weather and climatology genuinely cannot already contain, and the actual subject of the hypothesis — adds five ten-thousandths of an AUC point: nothing. The one constructive crumb is worth stating plainly so it isn't oversold: a cyclic day-of-year prior is free (the date is always known) and does improve temporal ranking, so a deployed fire-danger product may as well include it — but it buys the season, not the day, and not the place. The elimination series is now complete: a better model, real fuel, road networks, lightning weather, and human-timing have each been tested on real cross-year ground truth, and none of them moves the operationally meaningful spatial-daily ceiling. Next-day ignition over Sicily sits at its practical limit with remotely-sourceable data, near 0.83–0.86 cross-region and cross-year. The remaining gain does not live in another reanalysis field or another map; it lives in ground-truth human-activity data — who is in which field today, where stubble is being burned this week — which is precisely the data we do not have and cannot pull from orbit. That is the honest end of the pre-ignition thread, and a clean place to stop.
Claim status: NEGATIVE (clean).
Current literature & PHOENIX alignment.Verdict: AGREEMENT on covariates and method, plus an explicit self-correction the literature would demand. Regional ML occurrence models [12][29] use the same land-cover / weather / human-geography covariates and temporally-held-out evaluation we use.
What the external literature reinforces: Mediterranean/North-African occurrence ML [12][29] validates climatology + weather + human geography as separable layers with temporal holdout and SHAP-style attribution.
Where PHOENIX is stricter or diverges: Earlier PHOENIX susceptibility AUCs were inflated by non-burnable sea, bare-rock and urban cells. On comparable burnable-land cells the useful signal is real but modest (AUC ~0.80 vs climatology ~0.76), validated leakage-free by a shuffled-feature placebo (~0.50). Fuel-moisture reviews [13][14] indicate the next gain needs real spatial fuel/fuel-moisture, not more model complexity.
What this post does not claim: The susceptibility layer is a useful static prior for triage and sensor/node placement, NOT a breakthrough location predictor; report the all-cell metric as diagnostic and the burnable-land metric for claims.
Next research test: Add live/dead fuel-moisture (LFMC), fuel load and crop/stubble seasonality; report calibration (Brier, reliability, decile lift); keep 'where fire can happen' separate from 'when it happens'.
Public data sources:NASA FIRMS active-fire archive + area API (VIIRS/MODIS/SLSTR truth) · Copernicus CDS ERA5 / ERA5-Land · ESA WorldCover 10 m land cover · JRC GHSL built-up + population · Hansen Global Forest Change tree cover · OpenStreetMap / GRIP roads. Every figure in this entry is reproducible from these public sources with no access to PHOENIX infrastructure; the method is stated above and in any linked code.
Statistical reporting: proportions are quoted with Wilson 95% confidence intervals and ranking metrics (AUC) with bootstrap 95% CIs; read the interval and the sample size n, not the point estimate. A shuffled-label placebo (≈0.5) accompanies learned separability claims.
entry 0069
The pre-ignition labels were a sparse sample — correcting the calendar result and the ceiling
Date: 2026-06-25 Status: correction (the fire-label set behind entries 0064–0069 was a sparse temporal *sample*, not a continuous record; re-run on the complete daily archive overturns the previous entry's seasonal finding and lowers the ceiling) — published because a wrong number we can name is worth more than a right-sounding one we can't
The analogy. A quietly serious correction. The fire labels behind several earlier pre-ignition entries weren't a continuous record — they were a sparse time-sample. Re-run on the complete daily archive, the previous entry's ‘seasonal’ finding overturns and the ceiling drops. We publish it because a wrong number we can name beats a right-sounding one we can't.
The previous entry reported that calendar features lift the pre-ignition score by +0.09, that essentially all of it is a day-of-year "seasonal envelope," and that the genuinely human signal — day-of-week, weekend, holiday — adds nothing. The human-timing half of that was right. The seasonal half was an artifact, and the way we found it is the whole point of this entry: while chasing down a smaller oddity — June showing exactly zero ignitions in the day-of-season marginal — we discovered the fire labels underneath *all* of the recent pre-ignition work were never a continuous record. They were a sparse sample: five-day windows pulled at five fixed calendar positions per summer (1 and 16 July, 1 and 16 August, 1 September), about twenty-five days a year, and no June at all. Roughly four out of five summer days had no fire labels pulled, so every cell-day on those days was scored as a non-ignition whether or not it actually burned.
That single fact poisons a day-of-year feature in the most seductive way possible. The sampled windows sit at the *same* day-of-year every year, so a cyclic day-of-year encoding does not need to learn anything about fire seasonality — it only needs to learn *which days were sampled*, because those are the only days a positive can appear. The +0.09 "seasonal envelope" was the model rediscovering our own sampling calendar. To see whether that was the whole story, we pulled the complete continuous daily fire archive for the same region and seasons — every day from June through September, 2019–2024, both standard-processing satellite products — which raised the detection count from 9,724 to 41,781 (4.3×) and, for the first time, included 5,097 June detections that the old set simply never contained.
Re-run on the honest labels, the calendar result collapses. Where the sparse data gave calendar-only an apparent 0.88, the complete data gives it 0.52 — chance. The day-of-year "seasonal" contribution on top of the full model falls from +0.089 to +0.003, and the human-weekly group stays where it was, at zero. In other words, once the labels are continuous, none of the calendar information — neither the season nor the week-rhythm — carries real pre-ignition skill. The earlier entry's headline finding was an artifact of how the data was sampled, and its sole surviving claim is the one it shared with this one: human-timing does not move the ceiling. That conclusion is now *stronger*, not weaker, because it no longer sits next to a seasonal effect that turns out not to exist.
The correction does not stop at the calendar, and honesty requires stating the larger consequence plainly. The same sparse sampling inflated the absolute ceiling reported across the pre-ignition entries. With four-fifths of days forced to look fire-free, the ranking task was artificially easy; on the complete daily labels the full climatology-plus-recency-plus-weather-plus-fuel model scores 0.79–0.80 cross-year, not the ~0.86 quoted before. The honest pre-ignition ceiling for next-day ignition over Sicily is therefore lower than we had been carrying. What this re-run does *not* by itself re-verify is the per-feature increments those entries reported — that real weather adds about +0.024, that the Fire Weather Index is the best single weather feature, that fuel adds a little — because each of those was measured against the same sparse labels and now has to be re-measured against the complete ones. Their *direction* is reasonable and their internal comparisons were like-for-like, but until they are re-run on the 41,781-detection archive we are treating their magnitudes as unconfirmed rather than asserting they survive. That re-measurement is the immediate next piece of work, and it now runs on a label set that finally reflects every day the island actually burned.
Two lessons sit on top of this. The first is specific: a calendar feature tested against calendar-sampled labels will always look good, and the only defense is labels that cover every day, not a representative-looking subset. The second is the one worth keeping — the same discipline that has produced six honest negatives this season produced this honest reversal, because the rule is the same in both directions. We checked a number that looked too good, found the data underneath it was thinner than we thought, replaced the data, and reported the smaller truth. The ceiling is lower, the calendar adds nothing, and the record is now built on every day of the fire season instead of one day in five.
Claim status: CORRECTED / SUPERSEDED.
Current literature & PHOENIX alignment.Verdict: AGREEMENT on covariates and method, plus an explicit self-correction the literature would demand. Regional ML occurrence models [12][29] use the same land-cover / weather / human-geography covariates and temporally-held-out evaluation we use.
What the external literature reinforces: Mediterranean/North-African occurrence ML [12][29] validates climatology + weather + human geography as separable layers with temporal holdout and SHAP-style attribution.
Where PHOENIX is stricter or diverges: Earlier PHOENIX susceptibility AUCs were inflated by non-burnable sea, bare-rock and urban cells. On comparable burnable-land cells the useful signal is real but modest (AUC ~0.80 vs climatology ~0.76), validated leakage-free by a shuffled-feature placebo (~0.50). Fuel-moisture reviews [13][14] indicate the next gain needs real spatial fuel/fuel-moisture, not more model complexity.
What this post does not claim: The susceptibility layer is a useful static prior for triage and sensor/node placement, NOT a breakthrough location predictor; report the all-cell metric as diagnostic and the burnable-land metric for claims.
Next research test: Add live/dead fuel-moisture (LFMC), fuel load and crop/stubble seasonality; report calibration (Brier, reliability, decile lift); keep 'where fire can happen' separate from 'when it happens'.
Public data sources:NASA FIRMS active-fire archive + area API (VIIRS/MODIS/SLSTR truth) · Copernicus CDS ERA5 / ERA5-Land · ESA WorldCover 10 m land cover · JRC GHSL built-up + population · Hansen Global Forest Change tree cover · OpenStreetMap / GRIP roads. Every figure in this entry is reproducible from these public sources with no access to PHOENIX infrastructure; the method is stated above and in any linked code.
Statistical reporting: proportions are quoted with Wilson 95% confidence intervals and ranking metrics (AUC) with bootstrap 95% CIs; read the interval and the sample size n, not the point estimate. A shuffled-label placebo (≈0.5) accompanies learned separability claims.
entry 0070
Re-checking the feature deltas on honest labels: weather and fuel survive, the Fire Weather Index's crown does not
Date: 2026-06-25 Status: confirmation + correction (the per-feature pre-ignition deltas from 0064–0066, re-measured against the complete 41,781-detection daily archive instead of the sparse sample) — two claims survive with revised magnitudes, one headline claim is overturned
The analogy. After fixing the sparse-label problem, we owed a re-check of every per-feature claim those earlier entries made. On the complete 41,781-detection archive: real weather and fuel survive (with smaller magnitudes), but the Fire Weather Index's claimed ‘crown’ does not. Two claims confirmed, one headline overturned — the honest accounting after a data fix.
The previous entry replaced the sparse fire labels with a complete daily archive, lowered the honest pre-ignition ceiling from ~0.86 to ~0.80, and flagged a debt: every per-feature increment those earlier entries reported — that real weather adds about +0.024, that the Fire Weather Index is the best single weather feature and carries unique drought-memory value, that fuel type adds a little — had been measured against the same sparse labels and therefore had to be re-measured before any of them could be trusted. This entry pays that debt. The setup is identical to before — climatology-plus-recency priors, gradient-boosted, leave-one-year-out across 2019–2024 — but now on the 194,568 complete cell-days where the labels reflect every day the island actually burned.
Two of the three claims survive, and both survive *cleanly* — positive in all six held-out years — but with magnitudes the sparse data had distorted in opposite directions. Weather still helps: adding the full weather block lifts the priors from 0.786 to 0.793, a +0.0075 pooled gain (mean +0.0085, six years out of six). That is real and consistent, but it is a third of the +0.024 the first weather entry reported — the sparse labels had inflated weather's apparent value, because a feature set that tracks the summer season looked more useful when the only labelled days were five fixed summer windows. Fuel also still helps, and here the sparse data had done the reverse: the complete-label fuel delta is +0.0098 (mean +0.0099, six of six), more than double the +0.0044 originally claimed. With real positives now spread across every day and every cell rather than concentrated in a few sampled windows, a static map of *what is there to burn* becomes more useful, not less. So the two survivors are genuine, and the corrected picture is a pre-ignition model that is overwhelmingly its priors (climatology and recency, 0.786 on their own) with weather and fuel each adding a real but small fraction of a point on top.
The third claim does not survive, and it was the headline of its entry. On the sparse labels the proper Canadian Fire Weather Index looked like the best single weather feature and carried a unique contribution of +0.0053 that no other variable could replace — the basis for the claim that the Index "earns its complexity." On honest labels it does not. The best single weather feature is now plain temperature (+0.0053 over priors), with vapour-pressure deficit second (+0.0039); the Fire Weather Index comes third (+0.0034), and once temperature and VPD are already in the model its unique contribution falls to +0.0008 — within noise of zero. The drought-memory advantage that justified the whole FWI apparatus was, like the calendar effect two entries ago, largely an alignment with the sampling: the Index climbs through the summer, the sampled windows sat in the summer, and so the Index looked like it was predicting fire when it was partly tracking *when we had looked*. At true daily resolution the signal that actually predicts tomorrow's ignition is today's heat and dryness, not a slowly-integrated drought code — which is physically sensible on Sicilian summer fuel that is already cured by July, where the day-to-day variation in ignition follows the day-to-day variation in temperature far more than the seasonal march of accumulated drought.
The operational consequence is concrete and, usefully, simplifying. A deployed Sicily fire-danger layer does not need the full Fire Weather Index machinery — the sequential FFMC/DMC/DC/BUI bookkeeping, the precipitation history, the per-cell drought state carried across the season. It needs the priors, instantaneous temperature and vapour-pressure deficit, and the fuel map, and it reaches the same ~0.80 ceiling with a fraction of the complexity. That is the opposite of the earlier entry's recommendation, and it is the honest one: when the labels were a sample we mistook a seasonal proxy for a physical mechanism, and the complete record shows the simpler weather features doing the same work. Three entries into re-checking work against complete labels — the calendar collapsed, the ceiling dropped, and now the Index's crown comes off while weather and fuel keep their smaller, real places — the pattern is consistent and worth stating plainly: the sparse sample did not just inflate one number, it systematically favoured the features that correlated with *the season we sampled* over the features that describe *the day and the place*. Correcting the labels corrects the conclusion.
Claim status: CORRECTED / SUPERSEDED.
Current literature & PHOENIX alignment.Verdict: AGREEMENT on covariates and method, plus an explicit self-correction the literature would demand. Regional ML occurrence models [12][29] use the same land-cover / weather / human-geography covariates and temporally-held-out evaluation we use.
What the external literature reinforces: Mediterranean/North-African occurrence ML [12][29] validates climatology + weather + human geography as separable layers with temporal holdout and SHAP-style attribution.
Where PHOENIX is stricter or diverges: Earlier PHOENIX susceptibility AUCs were inflated by non-burnable sea, bare-rock and urban cells. On comparable burnable-land cells the useful signal is real but modest (AUC ~0.80 vs climatology ~0.76), validated leakage-free by a shuffled-feature placebo (~0.50). Fuel-moisture reviews [13][14] indicate the next gain needs real spatial fuel/fuel-moisture, not more model complexity.
What this post does not claim: The susceptibility layer is a useful static prior for triage and sensor/node placement, NOT a breakthrough location predictor; report the all-cell metric as diagnostic and the burnable-land metric for claims.
Next research test: Add live/dead fuel-moisture (LFMC), fuel load and crop/stubble seasonality; report calibration (Brier, reliability, decile lift); keep 'where fire can happen' separate from 'when it happens'.
Public data sources:NASA FIRMS active-fire archive + area API (VIIRS/MODIS/SLSTR truth) · Copernicus CDS ERA5 / ERA5-Land · ESA WorldCover 10 m land cover · JRC GHSL built-up + population · Hansen Global Forest Change tree cover · OpenStreetMap / GRIP roads. Every figure in this entry is reproducible from these public sources with no access to PHOENIX infrastructure; the method is stated above and in any linked code.
Statistical reporting: proportions are quoted with Wilson 95% confidence intervals and ranking metrics (AUC) with bootstrap 95% CIs; read the interval and the sample size n, not the point estimate. A shuffled-label placebo (≈0.5) accompanies learned separability claims.
entry 0071
The same Sicily burns every year: fire geography is nearly stationary, which is why location is the strongest prior — and where that prior ends
Date: 2026-06-25 Status: defensible (complete FIRMS archive, 41,781 detections 2019–2024; spatial stationarity, concentration and prior-ground analysis at two cell sizes) — a data-foundation result that explains several earlier findings and bounds them
The analogy. Ask not which model is best but a fact about the place itself: how much does Sicily's fire map move year to year? Across six years it barely moves — the same areas burn again and again, which is exactly why ‘where it burned before’ is the single strongest predictor. The grade is spatial stationarity and concentration; this explains why our other priors add only small increments, and where that prior runs out.
Across the pre-ignition work one fact kept doing the heavy lifting and was never examined directly: climatology — simply *where fire has been* — was the dominant predictor, and weather and fuel added only small increments on top of it. The honest question underneath that is a property of the data, not of any model: how stationary is Sicily's fire geography from one year to the next? If the same ground burns every summer, a location prior is nearly deterministic and there is little left for anything else to explain. If fire moves around year to year, climatology should be weak and the field is wide open. This entry measures it directly, and the answer is unusually clean.
Sicily's fire footprint is nearly fixed. At an 11-kilometre grid, only 312 cells ever burn across the six years, and 200 of them burn in all six years — those perennial cells alone account for 88.5% of every detection in the archive. Widen the criterion slightly and it gets starker: cells that burn in at least four of the six years are 84% of the burning cells and hold 97% of all fire. The single most operational way to say it is to ask, for each year, how much of that year's fire lands on ground that had *already* burned in some previous year — and the answer is 98 to 99.9%. In a typical summer, barely one or two percent of Sicily's fire occurs on genuinely new ground; essentially all of it recurs where fire has happened before. The result is robust to how finely you slice the map: at a 5.5-kilometre grid the prior-burned fraction averages 95%, the four-year cells still hold 89% of fire, and the conclusion does not move — only the small new-ground sliver grows a little as the cells shrink, exactly as it should.
But stationarity of the *footprint* is not the same as stationarity of *intensity*, and the honest version of this result needs both halves. The inter-year spatial correlation of per-cell counts is only 0.51 at the coarse grid and 0.65 at the fine one — moderate, not high. So while the set of places that *can* burn is almost perfectly fixed, *how much* burns in each of them swings substantially from year to year: a cell that dominates one summer may be quiet the next, driven by which particular fires happen to ignite and run. The precise statement is therefore two-sided — where fire is possible in Sicily is nearly deterministic; how much burns where is not — and conflating the two would overstate the predictability. The footprint is a fixed map; the loading on that map is a yearly lottery.
That single distinction explains the shape of everything built on top of it. It is why climatology is the strongest pre-ignition feature and why weather and fuel add so little: with 95-99% of fire confined to previously-burned ground, knowing the footprint already answers most of the *where* question, and the only thing left for a dynamic feature to contribute is the much harder, lower-variance *how much* and *which of the known cells this week* — exactly the residual the pre-ignition ceiling sits at. It is also why a verifier tested on held-out *years* scores so much higher than one tested on held-out *regions*: predicting a future year of Sicily is easy because the same ground burns and the model has memorised it, while predicting an unseen region is hard because the model's strength *is* that memorised footprint and a new geography hands it nothing to stand on. The stationarity that makes the temporal problem easy is the very thing that makes the spatial-transfer problem hard; they are two faces of one data property, not two separate findings.
The operational reading is constructive and it comes with its own ceiling. The perennial backbone — a few hundred fixed cells carrying the overwhelming majority of fire — is a knowable, stable map that a monitoring or pre-positioning system can lean on directly, because it does not move. But the same number that makes the backbone useful sets the limit of any purely location-based prior: the one-to-five percent of fire that lands on new ground each year is invisible to a model that only knows where fire has been, and it is precisely the part that a location prior can never recover and that any dynamic signal — weather, ignition source, the multi-day and cross-sensor confirmation channels — has to earn its keep on. A system for Sicily should treat the recurrent backbone as nearly solved and spend its modelling effort on the small, stubborn, genuinely-novel fraction, while never forgetting that the very thing making its home turf predictable is what will fail it the day it is asked to watch a coast it has never seen burn.
Claim status: SUPPORTED.
Current literature & PHOENIX alignment.Verdict: AGREEMENT on covariates and method, plus an explicit self-correction the literature would demand. Regional ML occurrence models [12][29] use the same land-cover / weather / human-geography covariates and temporally-held-out evaluation we use.
What the external literature reinforces: Mediterranean/North-African occurrence ML [12][29] validates climatology + weather + human geography as separable layers with temporal holdout and SHAP-style attribution.
Where PHOENIX is stricter or diverges: Earlier PHOENIX susceptibility AUCs were inflated by non-burnable sea, bare-rock and urban cells. On comparable burnable-land cells the useful signal is real but modest (AUC ~0.80 vs climatology ~0.76), validated leakage-free by a shuffled-feature placebo (~0.50). Fuel-moisture reviews [13][14] indicate the next gain needs real spatial fuel/fuel-moisture, not more model complexity.
What this post does not claim: The susceptibility layer is a useful static prior for triage and sensor/node placement, NOT a breakthrough location predictor; report the all-cell metric as diagnostic and the burnable-land metric for claims.
Next research test: Add live/dead fuel-moisture (LFMC), fuel load and crop/stubble seasonality; report calibration (Brier, reliability, decile lift); keep 'where fire can happen' separate from 'when it happens'.
Public data sources:NASA FIRMS active-fire archive + area API (VIIRS/MODIS/SLSTR truth) · Copernicus CDS ERA5 / ERA5-Land · ESA WorldCover 10 m land cover · JRC GHSL built-up + population · Hansen Global Forest Change tree cover · OpenStreetMap / GRIP roads. Every figure in this entry is reproducible from these public sources with no access to PHOENIX infrastructure; the method is stated above and in any linked code.
Statistical reporting: proportions are quoted with Wilson 95% confidence intervals and ranking metrics (AUC) with bootstrap 95% CIs; read the interval and the sample size n, not the point estimate. A shuffled-label placebo (≈0.5) accompanies learned separability claims.
entry 0078
A fire-danger map that peaks on a volcano: furnace contamination in the climatology, and the small ceiling correction it was hiding
Date: 2026-06-25 Status: correction + defensible (complete archive; the pre-ignition climatology and cross-year model rebuilt with the persistent-source mask applied to the labels) — the false-positive doctrine turned back on our own training data, with a measurable consequence
The analogy. Our ‘where fire starts’ map had a tell-tale flaw: its hottest spot was Mount Etna — a volcano, not a wildfire zone. The pre-ignition and false-positive threads were built from the same raw data but never compared notes, letting furnace heat leak into the danger map. Masking the persistent sources fixes the map and slightly corrects the ceiling. Data hygiene, caught by turning our own false-positive doctrine on our training labels.
The pre-ignition work and the false-positive work were built on the same raw material — the FIRMS detection archive — but they never talked to each other, and that gap turns out to hide a mistake. The false-positive thread established that roughly an eighth of the detections are not wildfires at all but persistent hot sources: Etna and Stromboli, the Priolo–Augusta and Gela and Milazzo industrial sites. The pre-ignition thread built its single strongest feature, the per-cell climatology, by counting *all* detections in each cell. Putting those two facts together for the first time produces an uncomfortable question: if the climatology counts a volcano's daily lava glow as "fire," what does the fire-danger map actually rank highest? The answer is exactly what you would fear. The top two cells in the raw climatology are Mount Etna — 1,979 and 1,252 detections, 98% and 97% of them volcanic — and the third is a contaminated coastal-industrial cell. The model's most important feature, asked where Sicily is most fire-prone, points first and most confidently at an active volcano.
Fixing it is a one-line application of the doctrine the false-positive work already validated: before building the climatology, drop the detections that fall in the persistent-furnace cells — the roughly one-kilometre locations that light up on fifteen or more distinct days, the always-on signature that the stationarity work showed is cleanly distinct from the few-days-a-year fire backbone. Twenty-six such cells exist; they hold 3,824 detections, 9% of the archive. With them removed, the climatology's top five cells become entirely genuine wildfire ground — the western-Sicily and Palermo-hinterland cells that carry zero false sources — and Etna drops out of the danger map entirely. The map now ranks fire country by fire, not by lava. For any downstream use of this layer — a danger overlay, a pre-positioning prior, a public-facing risk map — that correction is the whole point: a wildfire product should not tell a fire service that the single most dangerous place on the island is the one place that burns for reasons no fire service can do anything about.
The contamination was also quietly inflating the headline number, and the honest accounting matters. Etna's cells do not just rank high in the climatology; they appear in the training data as cells that are detected as "burning" nearly every single day, which makes them *trivially* predictable positives — the model scores them correctly with no skill required, and that free accuracy props up the cross-year AUC. Rebuilding the model on the furnace-cleaned labels moves the score from 0.803 to 0.793, a drop of 0.010, as 1,386 of those easy always-positive cell-days leave the positive class. It is a small correction, but it is real and it runs in the honest direction: the genuine difficulty of predicting *wildfire* over Sicily is very slightly higher than the contaminated number implied, because some of that 0.80 was the model being rewarded for "predicting" a volcano that erupts on schedule. Stacked on the earlier, larger correction — the sparse-sampling fix that brought the ceiling down from an inflated 0.86 to 0.80 — the fully honest pre-ignition ceiling for next-day *wildfire* ignition settles at about 0.79.
The wider lesson is the one worth keeping. A false-positive filter is usually thought of as a thing you apply to the live feed, at the output end, to keep furnaces out of alerts. But the same furnaces are sitting in the *training* data, in the climatology, in every per-cell statistic a model learns from, and there they do their damage silently — not as a visible bad alert but as a mis-ranked map and a flattering metric. The persistent-source mask earns its keep twice over: once at the output, where it removes 89% of the false-source contamination from the feed, and once at the input, where it stops a volcano from teaching the model what a wildfire looks like. Cleaning the data the model learns from is the same job as cleaning the alerts it emits, and until this pass the pre-ignition side of the system had only been doing half of it.
Claim status: CORRECTED / SUPERSEDED.
Current literature & PHOENIX alignment.Verdict: AGREEMENT on covariates and method, plus an explicit self-correction the literature would demand. Regional ML occurrence models [12][29] use the same land-cover / weather / human-geography covariates and temporally-held-out evaluation we use.
What the external literature reinforces: Mediterranean/North-African occurrence ML [12][29] validates climatology + weather + human geography as separable layers with temporal holdout and SHAP-style attribution.
Where PHOENIX is stricter or diverges: Earlier PHOENIX susceptibility AUCs were inflated by non-burnable sea, bare-rock and urban cells. On comparable burnable-land cells the useful signal is real but modest (AUC ~0.80 vs climatology ~0.76), validated leakage-free by a shuffled-feature placebo (~0.50). Fuel-moisture reviews [13][14] indicate the next gain needs real spatial fuel/fuel-moisture, not more model complexity.
What this post does not claim: The susceptibility layer is a useful static prior for triage and sensor/node placement, NOT a breakthrough location predictor; report the all-cell metric as diagnostic and the burnable-land metric for claims.
Next research test: Add live/dead fuel-moisture (LFMC), fuel load and crop/stubble seasonality; report calibration (Brier, reliability, decile lift); keep 'where fire can happen' separate from 'when it happens'.
Public data sources:NASA FIRMS active-fire archive + area API (VIIRS/MODIS/SLSTR truth) · Copernicus CDS ERA5 / ERA5-Land · ESA WorldCover 10 m land cover · JRC GHSL built-up + population · Hansen Global Forest Change tree cover · OpenStreetMap / GRIP roads. Every figure in this entry is reproducible from these public sources with no access to PHOENIX infrastructure; the method is stated above and in any linked code.
Statistical reporting: proportions are quoted with Wilson 95% confidence intervals and ranking metrics (AUC) with bootstrap 95% CIs; read the interval and the sample size n, not the point estimate. A shuffled-label placebo (≈0.5) accompanies learned separability claims.
entry 0080
We looked for the lightning, and it isn't there
Date: 2026-06-26 Status: defensible (two independent instruments — MTG-LI lightning vs FIRMS VIIRS fire — with a before/after asymmetry test and two independent nulls, over Sicily, late May–June 2026)
The analogy. We kept saying Sicily's summer fires are human-lit, not lightning-struck — but only by inference from a weather proxy, and proxies can mislead. This time we used the real instrument: the new Meteosat lightning imager, checked against actual fires for a before/after spike. There was none — no lightning precursor, confirmed by two independent null tests. The direct measurement backs the human-ignition story and supersedes the earlier preliminary entry [0022].
A recurring theme in our pre-ignition work is that Sicily's summer fires are *human*-ignited — set by people and machines on hot, dry land, not struck from the sky. We argued it before (entry 0068) but only indirectly: we showed that a convective-weather proxy, CAPE, carried no predictive signal for next-day ignition, and reasoned that lightning therefore wasn't the trigger. That is an inference from a proxy, and a proxy can mislead. This time we tested it with the thing itself. The Meteosat Third Generation Lightning Imager (MTG-LI) records actual lightning flashes; NASA's FIRMS VIIRS records actual fires. Both stream into PHOENIX. So we can ask the direct question: do real lightning strikes actually precede real fire ignitions in space and time?
The naive version of that question is a trap, and it is worth seeing why. Over our window — 17,393 flashes and 802 distinct FIRMS ignition events across Sicily from 25 May to 24 June 2026 — 8.9% of fires had a lightning strike within 10 km in the 48 hours *before* ignition. That sounds like a real link, and a time-shuffled null makes it look realer still (only ~3.2% of randomly-retimed fires have a preceding strike). But that comparison is confounded at its root: lightning and fire both concentrate in the same hot, convective stretches of the season, so *any* test that just asks "were they close in time" conflates same season with same cause. Lightning was confined to 16 storm-days; fires cluster in the same dry spells. You will always find temporal co-occurrence between two things that summer drives in parallel. The proxy ambiguity that made 0068 an inference lives right here.
The clean test removes the confound by comparing at each fire's own place and time. If a strike *ignites* a fire, the strike must come *before* it — strikes in the hours *after* a fire are causally irrelevant, so they make a perfect control. Among the 132 fires that had a nearby strike on exactly one side, 71 came before and 61 came after — a near-even split (binomial *z* = 0.87, *p* = 0.38). The before/after ratio is 1.16, indistinguishable from the 1.0 you expect when lightning is merely coincident weather rather than the cause. There is no precursor asymmetry. Whatever lightning is doing near these fires, it is just as likely to follow them as to precede them — the signature of shared convective weather, not ignition.
The decisive number is the second null. We kept every fire's real timestamp but swapped its location for another fire's, then re-asked how often a strike preceded it. If a fire's *own* location were specially struck before it burned, the real fraction would beat this shuffle. It doesn't: the location-shuffled fraction is 9.0%, against an observed 8.9% — they are the same to within a rounding error. A fire's own ground is no more likely to have been struck in the preceding two days than some *other* fire's ground. The entire 8.9% "preceding-strike" rate is explained by the background density of lightning during fire season, with nothing left over that attaches a specific strike to a specific fire. The link isn't weak — it is absent.
So the direct evidence agrees with the proxy, and now we can say it without the hedge: in this Sicilian window, lightning does not start the fires. That tightens the picture from 0068 and 0078 — the same agricultural ground burns each year, ignited where people are, not where the sky strikes — and it has an operational edge. It tells us not to spend a feature, an alert, or an analyst's attention on lightning as an ignition precursor for Sicily, and it shows the method to use when fire and weather travel together: don't ask whether they co-occur, ask whether one sits at the *other's* place and time more than chance allows. Two honest caveats bound the claim. This is a single early-summer window of a single year; the high-lightning peak of July–August is not yet in this dataset, and we will re-run when it is. And MTG-LI sees *total* lightning, including intracloud flashes that can't reach the ground — but that only hardens the conclusion, since even counting every flash in the sky, none of them lead to the fires below.
Claim status: SUPPORTED.
Current literature & PHOENIX alignment.Verdict: a LOCAL disagreement, stated as a falsifiable empirical finding. Lightning's importance is strongly region-dependent [30]; our direct MTG-LI test finds no lightning precursor for Sicily early-summer fires, which are human-lit.
What the external literature reinforces: EUMETSAT [8] confirms the MTG Lightning Imager capability we used; cause-attribution ML [31] frames ignition-cause as a legitimate research lane; Texas work [30] shows lightning does matter in other ecosystems — so our null is a Sicily-specific result, not a universal claim.
Where PHOENIX is stricter or diverges: This is an early-season Sicily result; it must be re-run during peak lightning season and against cloud-to-ground (not only total) lightning before any broad seasonal statement.
What this post does not claim: Do not claim lightning is generally irrelevant to wildfire; the claim is bounded to the tested Sicily window.
Next research test: Re-run MTG-LI vs FIRMS for July-September; distinguish intracloud from cloud-to-ground; sweep radii (1-20 km) and lead windows (0-1h..24-72h) with permuted-location and permuted-time nulls.
Public data sources:EUMETSAT MTG Lightning Imager · Copernicus CDS ERA5 / ERA5-Land · NASA FIRMS active-fire archive + area API (VIIRS/MODIS/SLSTR truth). Every figure in this entry is reproducible from these public sources with no access to PHOENIX infrastructure; the method is stated above and in any linked code.
Statistical reporting: proportions are quoted with Wilson 95% confidence intervals and ranking metrics (AUC) with bootstrap 95% CIs; read the interval and the sample size n, not the point estimate. A shuffled-label placebo (≈0.5) accompanies learned separability claims.
entry 0082
Citizens & delivery
Getting warnings to people — and treating a resident's report not as a hint but as a primary detection.
The analogy. A wildfire detector is only useful if it reaches people, so one pillar of PHOENIX is an app that lets any Sicilian report a fire from their phone — even with no signal, syncing later. Reports are cross-checked against satellites and a farmer network before they're trusted. This entry documents that delivery pillar: an open-source, offline-first Android app. It is infrastructure, not a measured claim.
The PHOENIX Citizen Android app is the project's citizen-reporting pillar, letting Sicilian (and eventually other) residents instantly report fires from their phone. Reports are validated on the PHOENIX backend against satellite detections (FIRMS / VIIRS / EUMETSAT / SLSTR) and farmer-network corroboration. The app is native Kotlin + Jetpack Compose (Material 3), min SDK 26 (Android 8.0, ~95% of Italian Android users), target SDK 34, MIT-licensed, package `com.phoenix.citizen`, source at `github.com/markl02us/phoenix-citizen-android`.
Architecture is offline-first: every report is written to a local Room database first, then submitted, with a WorkManager periodic SyncWorker (15-minute) draining the queue and refreshing corroboration whenever the device has network. The app calls four backend endpoints on adr-wildfire.com: `/api/citizen_report` (POST), `/api/citizen_report_status` (GET), `/api/detections` (GET, for the map), and `/api/source_health` (GET). A report carries a stable per-install device hash, lat/lon, UTC timestamp, observation type (flame / smoke / unsure), optional observed wind direction, photo, and note. Every POST includes an `X-Integrity-Token` (Play Integrity API) for device attestation.
This app is goal-level, not peripheral: PHOENIX's foundational objective is delivering wildfire information TO citizens better/faster/more accurately than anyone else, so the citizen app, public site, and alerting are core performance surface. The app also makes citizen submissions a high-trust ground-truth source that can confirm satellite detections, especially for the weak-signal small/grass fires that sit below the satellite burn-scar floor.
Claim status: SUPPORTED.
Current literature & PHOENIX alignment.Verdict: AGREEMENT — citizen and ground evidence are scientifically valuable precisely because satellite precision ceilings exist.
What the external literature reinforces: Cross-domain flame/smoke corpora [3] show ground/UAV imagery complements spaceborne detection; citizen reports are best treated as uncertain weak labels, not truth.
Where PHOENIX is stricter or diverges: Citizen reports need trust scoring, GPS-uncertainty handling, deduplication, spam/adversarial defence and provenance before they enter fusion as anything more than a weighted, non-detection-grade corroborator.
What this post does not claim: A citizen report or a single camera clip is not, by itself, a confirmed detection.
Next research test: Build a citizen-report trust score (reporter history, GPS uncertainty, freshness, media, duplicate clustering, satellite/camera/weather corroboration) and an active-learning loop (confirmed -> labels, ambiguous -> review queue, malicious -> quarantine).
Public data sources: PHOENIX Citizen app (public repo) + NASA FIRMS active-fire archive + area API (VIIRS/MODIS/SLSTR truth). Every figure in this entry is reproducible from these public sources with no access to PHOENIX infrastructure; the method is stated above and in any linked code.
Statistical reporting: proportions are quoted with Wilson 95% confidence intervals and ranking metrics (AUC) with bootstrap 95% CIs; read the interval and the sample size n, not the point estimate. A shuffled-label placebo (≈0.5) accompanies learned separability claims.
entry 0014
Citizen reports aren't a hint — they're a detection. What the Raffadali fire taught us about fusing the crowd
Date: 2026-06-18 Status: preliminary (mechanism built in shadow; validated on one real case; not promoted)
The analogy. For the fires that most need the public's help, a citizen's photo of smoke isn't a hint that helps a detector — it IS the detection: at the Raffadali fire our satellites saw literally nothing, yet a resident's report was actionable about 90 minutes before any satellite alert could have arrived.
BLUF. We set out to fuse citizen reports the obvious way: treat a report of smoke as a *prior* that relaxes our satellite detectors near that spot, exactly as we already do for FIRMS hits. We built that mechanism in shadow. Then we validated it against the one real, confirmed case we have — the Raffadali windmill fire a local resident reported on 17 June — and the data corrected our design. At Raffadali that day our own detectors had nothing: not a confirmed fire, not even a sub-threshold candidate to relax onto. The fire was simply below our geostationary sensors' floor. A prior that lowers a detection threshold cannot surface a signal that was never there. The lesson: for the fires that most need the crowd, the citizen report is not a hint that sharpens a detector — it is the detection. The right design is a direct citizen surfacing tier, with the threshold-relaxing prior kept as a secondary aid for borderline cases.
What we built. A shadow citizen-anchored-prior emitter, mirroring our FIRMS-anchored prior: each report becomes a short-lived, spatially-bounded relaxation of nearby detector thresholds, scaled by the reporter's reputation and what they saw (open flame counts for more than "unsure," a trusted device for more than a brand-new one). It reads reports read-only and writes only to its own shadow table — it touches no live detector. The mechanism works and is reputation-weighted as intended.
What the real case showed. The Raffadali fire was genuinely confirmed — VIIRS caught it across multiple passes, building past 5 MW, and a burn signature followed. But on the day it mattered, three facts lined up: (1) our own detectors produced *zero* candidates there, sub-threshold or otherwise; (2) the earliest satellite pass sensed the fire at 11:45 but, with roughly two and a half hours of standard near-real-time data latency, that alert would not have surfaced until past 14:00; (3) the resident's report was actionable at 12:51. So the human was the earliest signal we could have acted on — by around an hour and a half — for a fire our satellites could not yet deliver and our own detectors could not see at all. A threshold-relaxing prior would have had nothing to attach to. The value was the report itself.
What this changes. Citizen reports already flow into our post-event burn-scar validation queue, so the back-end fusion exists. The missing piece is the front end: a first-class citizen tier on the public map, where a sufficiently-corroborated, sufficiently-reputable report stands as its own surfaced observation — independent of whether any satellite has caught up yet — with the burn-scar check then confirming or retiring it after the fact. The anchored-prior remains worth keeping for *near*-floor fires, where a faint sub-threshold signal does exist and a nudge could pull it over the line; but we cannot yet validate that path, because every citizen report we currently hold is uncorroborated test data. We are not promoting either mechanism. We are recording that the crowd's real contribution, on the one case we can check, was not to refine a machine detection but to *be* one — earlier than the machines could manage.
Current literature & PHOENIX alignment.Verdict: AGREEMENT — citizen and ground evidence are scientifically valuable precisely because satellite precision ceilings exist.
What the external literature reinforces: Cross-domain flame/smoke corpora [3] show ground/UAV imagery complements spaceborne detection; citizen reports are best treated as uncertain weak labels, not truth.
Where PHOENIX is stricter or diverges: Citizen reports need trust scoring, GPS-uncertainty handling, deduplication, spam/adversarial defence and provenance before they enter fusion as anything more than a weighted, non-detection-grade corroborator.
What this post does not claim: A citizen report or a single camera clip is not, by itself, a confirmed detection.
Next research test: Build a citizen-report trust score (reporter history, GPS uncertainty, freshness, media, duplicate clustering, satellite/camera/weather corroboration) and an active-learning loop (confirmed -> labels, ambiguous -> review queue, malicious -> quarantine).
Public data sources: PHOENIX Citizen app (public repo) + NASA FIRMS active-fire archive + area API (VIIRS/MODIS/SLSTR truth). Every figure in this entry is reproducible from these public sources with no access to PHOENIX infrastructure; the method is stated above and in any linked code.
Statistical reporting: proportions are quoted with Wilson 95% confidence intervals and ranking metrics (AUC) with bootstrap 95% CIs; read the interval and the sample size n, not the point estimate. A shuffled-label placebo (≈0.5) accompanies learned separability claims.
entry 0036
Alessandria della Rocca ground sensor v1.0 — scoping
Date: 2026-06-05 Status: scoping (build NOT authorized)
The analogy. Satellites have a floor; a camera on a hill does not. This entry scopes a ground sensor for our anchor Sicilian village — a small computer plus an AI camera watching for smoke and flame to confirm fires the satellites can't feel. It is a scoping document (build not authorized), laying out the parts and design. No performance is claimed yet — it's a costed plan, on the record.
PHOENIX scoped a v1.0 ground-based wildfire detection sensor for Alessandria della Rocca (Agrigento, Sicily), the project's anchor pilot site, as the ground pillar that complements the satellite track with on-site optical confirmation. This is the PHOENIX "Track 2" model — the only model artifact pushed to the Sicily collaborator (Gaetano) — distinct from the satellite detector models that run online on PHOENIX infrastructure.
Reference bill of materials: Raspberry Pi 5 + AI HAT (Hailo-8/8L NPU) running a YOLO smoke/flame detector on one RTSP IP-camera stream, deployed as a Hailo Executable Format (`.hef`) compiled from a PyTorch checkpoint; an AREDN mesh node (ham-licensed-operator only, treated as an optional path); a LoRa radio backup (region-locked EU868 for Sicily) for telemetry when AREDN/internet is down; and field hardening (IP66 enclosure, PoE or solar power, camera mount). The ground-sensor vision model must be trained clean-slate on Sicilian footage — it is a PHOENIX-specific model, not a shared module.
Onboarding follows a Wunderground analogue: power on → configure via a captive-portal web UI → device claims itself and reports into the PHOENIX backend over mTLS. Scoping notes: ~80% of the work is non-software (hardware BOM/supply, field hardening, regulatory split); AREDN's ham-license requirement means the unlicensed path must stay clean by keeping AREDN optional; the LoRa frequency plan is region-locked. ADRIZ has NOT authorized the physical build — this remains a feasibility scope awaiting an explicit go.
Claim status: EXPLORATORY (scoping — not built).
Current literature & PHOENIX alignment.Verdict: AGREEMENT — a ground optical/thermal node is the right complement to a satellite floor; this entry is scoping, so no performance is claimed.
What the external literature reinforces: Ground/UAV flame-smoke detection [3] and thermal-anomaly deep learning [23] support an on-site camera (plus optional seismic/thermal) confirming fires the satellites cannot feel.
Where PHOENIX is stricter or diverges: Deployment target (edge device vs operations-room workstation) is scope-dependent and must not be assumed; this is a costed plan, build not authorized.
What this post does not claim: No detection performance is claimed from a scoping document.
Next research test: On authorization, field the node and measure real smoke/flame detection against bulletin-confirmed local events; add a night/thermal lane and satellite-thermal corroboration.
Public data sources:FASDD / Pyronear public flame-smoke corpora · Smithsonian GVP (INGV-OE Etna 211060). Every figure in this entry is reproducible from these public sources with no access to PHOENIX infrastructure; the method is stated above and in any linked code.
Statistical reporting: proportions are quoted with Wilson 95% confidence intervals and ranking metrics (AUC) with bootstrap 95% CIs; read the interval and the sample size n, not the point estimate. A shuffled-label placebo (≈0.5) accompanies learned separability claims.
entry 0012
Seismic-puck addendum to the Alessandria ground sensor
Date: 2026-06-07 Status: scoping (build NOT authorized)
The analogy. Earthquakes start fires — broken gas lines, downed power — and Sicily is both quake- and fire-prone, so one ground node can honestly serve both jobs. This addendum scopes adding a buried vibration (‘P-wave’) sensor to the village camera node, with three cost/power tiers. Like its parent, it is a scoping plan (build not authorized), not a tested result.
PHOENIX scoped a ground-coupled seismic ("P-wave") puck as an add-on to the Alessandria della Rocca ground wildfire sensor. The rationale: earthquakes are a leading indicator for fires (broken gas lines, downed power, post-quake ignitions), and Sicily/Etna seismic and wildfire risk are co-located, so one node legitimately serves both INGV and PHOENIX. The puck sits 3–5 m from the camera pole on a poured concrete pad (pole-mounting is useless due to wind sway). Power impact is modest: +0.2 to +1.7 W on a ~10–12 W baseline.
Sensor tiers were costed: Tier A (ADXL355 MEMS, +$60 / +0.2 W); Tier B (SM-24 geophone + ADS1256 ADC, +$150 / +0.3 W); Tier C (Raspberry Shake RS1D, +$415 / +0.5 W, INGV-queryable out of the box); Tier D (RS3D 3-component, +$740 / +1.7 W). On 2026-06-08 ADRIZ chose the DIY Raspberry-Shake-equivalent path (so PHOENIX owns the sensor identity), co-located on the camera Pi 5, with calibration by cross-comparison against a known INGV station on Etna; estimated BOM ~$260 (1D) or ~$430 (3D).
Ingestion path: SeedLink over TCP (MiniSEED Steim2), channels EHZ/HHZ/ENZ, via either the AM-network (RS1D) or a new EIDA network code (INGV-Catania as natural host). On-device STA/LTA triggering (ObsPy `recursive_sta_lta`) runs at <5% of one core. A mandatory cross-validation gate requires either a neighbouring AREDN node trigger within ±30 s or an INGV FDSN event within ±60 s / ≤100 km before raising PHOENIX detection sensitivity in the affected cells (`post_seismic_window` = 24 h, 72 h for M≥4.5); a single node never autonomously raises sensitivity. Two questions remain open before procurement: 1D vs 3D, and whether single-node "unverified" raises are allowed at v1.0.
Claim status: EXPLORATORY (scoping — not built).
Current literature & PHOENIX alignment.Verdict: AGREEMENT — a ground optical/thermal node is the right complement to a satellite floor; this entry is scoping, so no performance is claimed.
What the external literature reinforces: Ground/UAV flame-smoke detection [3] and thermal-anomaly deep learning [23] support an on-site camera (plus optional seismic/thermal) confirming fires the satellites cannot feel.
Where PHOENIX is stricter or diverges: Deployment target (edge device vs operations-room workstation) is scope-dependent and must not be assumed; this is a costed plan, build not authorized.
What this post does not claim: No detection performance is claimed from a scoping document.
Next research test: On authorization, field the node and measure real smoke/flame detection against bulletin-confirmed local events; add a night/thermal lane and satellite-thermal corroboration.
Public data sources:FASDD / Pyronear public flame-smoke corpora · Smithsonian GVP (INGV-OE Etna 211060). Every figure in this entry is reproducible from these public sources with no access to PHOENIX infrastructure; the method is stated above and in any linked code.
Statistical reporting: proportions are quoted with Wilson 95% confidence intervals and ranking metrics (AUC) with bootstrap 95% CIs; read the interval and the sample size n, not the point estimate. A shuffled-label placebo (≈0.5) accompanies learned separability claims.
entry 0013
A provider can refuse you with HTTP 200 by painting the refusal into the pixels
Date: 2026-09-05 Status: SUPPORTED (reproduced, detector calibrated against live positives and negatives)
The analogy. A locksmith who changes the lock sends you a letter. A locksmith who quietly paints NOT YOURS across the door does not — and if you only ever check whether the door opens, you will never notice.
BLUF. The public map had been serving a basemap with API KEY REQUIRED printed diagonally across every tile, for an unknown length of time. A survey four days earlier had checked all seven public surfaces for HTTP 401, 402, 403 and 429, found none, and recorded the problem as not reproducible. It was reproducible the entire time. CARTO does not fail the request — it returns HTTP 200 with image/png and draws the refusal into the image.
Esri's Canvas basemaps do the same thing in a different costume: above zoom 16 they return 200 with “Map data not yet available” drawn on a constant 2,521-byte tile that is byte-identical at every location on Earth. Two independent vendors, the same failure class, neither visible to a status-code check.
The detector, and two that did not work. Counting pixels identical across tiles was tried first: it scored a provably clean grey basemap at 16.5% and genuinely watermarked CARTO at 14.2% — backwards — and then missed CARTO entirely once the sample grew past six tiles, because a translucent mark over varying ground is not bit-identical. High-pass energy of the median image failed the other way: a satellite median retains real texture, so healthy imagery scored higher than a watermark.
What works is a correlation. Fetch the same tile template at twelve separated Sicilian locations, high-pass each to strip its broad colour, and correlate them against one another. Palermo's streets have nothing to do with Ragusa's, so a healthy provider scores about zero; anything stamped onto every tile is a component they all share. Measured: CARTO voyager 0.42–0.58, CARTO dark 0.77–0.84, Esri's placeholder 1.00, and every healthy provider between −0.002 and +0.010. The bar sits at 0.15, three times below the weakest true positive and forty-five times above the strongest true negative.
Where this work is stricter. The check ships with a self-test that points the detector at providers known to be gated right now and fails if they come back clean, so it cannot quietly decay into something that always passes. That self-test caught a regression during development that the main check did not.
Method note. A third watermarked map was found only by screenshot: its tile URL lives in Worker-served JavaScript that the page injects on a tab click, so no grep of the page HTML would ever have seen it. Auditing basemaps means grepping the served scripts and clicking every tab.
Every CAP alert we had ever produced was schema-invalid, and 175 of them pointed at the Gulf of Guinea
BLUF. The Common Alerting Protocol feed had produced 6,689 alerts. All 6,689 fail CAP 1.2 schema validation, because the <sent> timestamp carried its UTC offset as +0000 where RFC 3339 requires +00:00.
A guard for exactly this already existed in the code. It tested whether the string contained no + in its final six characters — and +0000 contains one. The guard could never fire, and had never fired since the day it was written.
The part that mattered more. 175 alerts, including the three most recent, placed the fire at 0.0000,0.0000 with an area description of ?, because latitude, longitude and area identifier all silently defaulted. That coordinate is open ocean in the Gulf of Guinea. An alert that sends responders to the wrong continent is worse than no alert, so the writer now refuses to emit one and records the caller instead. None of the 6,689 carried an expiry, so a consumer could not distinguish a live alert from a stale one.
Claim status. No consumer was subscribed to this feed, so nobody was misdirected. That is luck, not design: the feed was being generated for an audience it had not yet reached.
Next research test. Validation against the Italian CAP-IT profile specifically, rather than generic CAP 1.2 — and a note for anyone building toward Italian civil protection: the national IT-alert cell-broadcast system's defined risk set does not include wildfire, so this feed's route to citizens is regional and provincial, not national.
Fusing it all into one picture
Combining the validated pieces into a single, auditable per-location wildfire picture.
The wildfire state — fusing what we know into one auditable picture
Date: 2026-06-19 Status: defensible (consolidation layer; built from individually-validated components)
BLUF. Detecting a fire answers one question — *is something burning here right now?* But managing wildfire needs the whole picture: how prone is this place to ignite, is it burning, how fast could it spread on its actual fuel and terrain, and what is its history. We have spent this stretch validating each of those signals individually and skeptically — proving what is real (multi-year recurrence forecasts ignition; a recent nearby fire bumps short-term risk) and discarding what isn't (raw corroborator counts, single-season recurrence). We have now fused the survivors into a single per-location "wildfire state" — one object that carries ignition risk, active-fire status, spread potential, and history together, with every component left visible so the fusion can be audited rather than trusted blindly. For Raffadali, the fire that drove much of this work, the state reads: *active fire, 11.7 MW, grass on an 11% slope so fast-spreading at ~89 m/min, low historical recurrence, last burned 2014.* That is the difference between a dot on a map and an assessment.
The analogy. A thermometer tells you a patient has a fever. A *chart* tells you the fever plus the history, the risk factors, and the likely course — and a good clinician shows their reasoning, not just a verdict. Our detectors are the thermometer; the wildfire state is the chart. We deliberately built the chart from measurements we each checked on their own first, because a chart assembled from unverified readings is worse than no chart — it is confident and wrong.
What it fuses (and where each piece came from). Four validated layers, combined per location:
- Ignition risk — multi-year fire recurrence, which we showed is a strong next-day forecaster *only* with deep history (single-season was worse than chance), plus a self-excitation bump when a neighbor has burned in the last day or two (a real but modest effect, used lightly).
- Active fire — the live detection / safety-net catch at the cell, with fire radiative power.
- Spread potential — the cell's real land cover (ESA WorldCover) mapped to a fuel model and run through the Rothermel rate-of-spread engine at its real slope (Copernicus DEM); grass on a slope spreads an order of magnitude faster than forest litter, and the state says so.
- History — the multi-year fire count and last-burn date at the location.
These collapse into a status label (*active fire / elevated risk / watch*) and a 0–100 composite, but the components stay attached. Nothing is hidden inside a single opaque number.
Why showing the fusion matters. Two reasons, one technical and one about trust. Technically, an auditable fusion is debuggable: when a location scores high we can see *why* — recurrence, or a fresh neighbor, or fast fuel — and catch a bad input before it misleads. For trust and project management, the fused view demonstrates that the system is more than a pile of separate detectors: it shows we have thought through what a wildfire *is* — a thing with a past, a present, and a trajectory — and assembled our evidence accordingly. Each of the 29 currently-surfaced fire locations now carries this full state, ranked by overall significance, so a reader sees not just where fires are but which deserve attention and why.
The honest scope. The fusion is only as good as its parts, and we have been candid about their limits: the multi-year recurrence and history layers are richest where we hold deep data; the spread figure uses a reference wind for the static state (live wind drives the real-time projection); and the composite weighting reflects the ablations we have run, not a final calibration. But the architecture is the point — a single, transparent wildfire state, built bottom-up from signals we proved one at a time. The detection answers "is it burning"; the state answers "what is the situation," and shows its work.
Claim status: SUPPORTED.
Current literature & PHOENIX alignment.Verdict: AGREEMENT — multi-sensor fusion and event-based confirmation are exactly the directions the current literature endorses.
What the external literature reinforces: High-temporal multi-source fusion [2] and FCI event tracking [5][7] support cross-instrument confirmation; PHOENIX adds the operational 'confirm-up only' rule.
Where PHOENIX is stricter or diverges: Agreement between two sensors confirms strongly, but coverage is partial (only a fraction of fires are co-observed), so absence of a second sensor must never reject a candidate.
What this post does not claim: Multi-sensor precision figures (~99%) apply only to the subset of fires multiple sensors happen to see; they are not a system-wide recall claim.
Next research test: Wire higher-cadence FCI/SLSTR/MODIS into the voter; quantify the co-observation coverage fraction per fire class; add provenance/source-independence audits to the corroboration logic.
Public data sources:NASA FIRMS active-fire archive + area API (VIIRS/MODIS/SLSTR truth) · EUMETSAT Data Store MSG-SEVIRI L1.5 · EUMETSAT Data Store MTG-FCI L1c / FCI-AF L2 · Copernicus Data Space Sentinel-3 SLSTR. Every figure in this entry is reproducible from these public sources with no access to PHOENIX infrastructure; the method is stated above and in any linked code.
Statistical reporting: proportions are quoted with Wilson 95% confidence intervals and ranking metrics (AUC) with bootstrap 95% CIs; read the interval and the sample size n, not the point estimate. A shuffled-label placebo (≈0.5) accompanies learned separability claims.
entry 0045
Five-fold duplication in the external-feed table, and the counts it quietly corrupted
BLUF.external_fires held 458,535 rows for 87,321 distinct observations — 5.25 copies of each. The identity of an observation is one sensor, one place, one acquisition time; every poll had been re-inserting rows that already existed.
Nothing about this was visible in a detection. It was visible in every COUNT(*) taken over the table: per-source feed statistics, the spatial window of the cluster-surfacing shadow detector, the SAR refutation pass, and the counts pushed to the public edge. A duplicated row does not create a false fire; it inflates the evidence that a real one is being seen repeatedly.
Where this work is stricter. The de-duplication keeps the row with the newest ingestion timestamp rather than the first. Keeping the oldest would have frozen the clock that feed-freshness alarms read, and a table that looks clean while raising false dead-feed alarms is not an improvement.
Next research test. Uniqueness is now enforced by the database rather than by the discipline of fifteen separate writers, which is the only version of this fix that stays fixed.
Where fire starts is written in the land — a fresh dataset confirms the "same Sicily burns every year" finding, and an honest de-inflation along the way
Date: 2026-06-28 Status: defensible (independent confirmation of [0066] and [0078] on a newly-pulled 2020–2026 dataset; one inflated figure caught and corrected; not promoted)
The analogy. Imagine trying to guess which streets in a town will have a house fire next year. One way is to look at where fires happened before — useful, but blind to a street that has never burned yet. Another way is to look at what the streets are made of: dry brush and farm stubble next to houses catch far more often than bare rock, water, or a city centre. We tested whether the second way — reading the landscape itself (farmland, scrub, grass, where people live) — tells us where Sicily's fires start. The grade we use is "AUC": 0.5 means no better than a coin flip, 1.0 means perfect. Our honest score on the land that can actually burn is about 0.80 — clearly better than a coin flip, and a little better than going by history alone (~0.76). Along the way we caught ourselves: a first number of 0.94 looked spectacular, but most of that was the model trivially knowing the sea and bare rock don't burn. We stripped that out and report the real, smaller number. The honest conclusion is a confirmation, not a breakthrough: the land really does carry where-it-burns information, exactly as [0066] and [0078] already found — and we add the "where people are" layer and a worked lesson in not fooling ourselves.
BLUF. On a freshly-pulled multi-year fire dataset (NASA FIRMS VIIRS S-NPP, 2020–2026, 33,061 Sicily fires), static human-geography — ESA WorldCover land cover, GHSL human settlement/population, Hansen tree cover — predicts which cells burn at cross-year AUC ~0.80 on burnable terrain, modestly beating a "where it burned before" climatology baseline (~0.76), with a placebo confirming no leakage. This independently confirms the established PHOENIX result that fire geography is nearly stationary ([0078]) and that land-cover/fuel adds a small honest increment ([0066]), now also including the human-settlement layer named as the lever in [0009]. We also document a de-inflation: an initial all-cells AUC of 0.94 was an artifact of trivially-classifiable sea/rock and is not the real figure.
The de-inflation (full transparency). The grid spans open Mediterranean sea (~29% of cells) plus bare-rock and urban cells — together only ~4% of fire but trivially "won't burn," which inflates the score. Restricting to the operationally-relevant burnable land:
| cross-year mean AUC | geography | climatology | dumb "veg-fraction" |
|---|---|---|---|
| all cells (inflated) | 0.94 | 0.91 | 0.84 |
| land only | 0.91 | 0.87 | 0.74 |
| burnable land (real) | 0.80 | 0.76 | 0.40 |
Three checks confirm the burnable-land signal is genuine: a placebo (shuffling the geography-to-cell link) collapses AUC to 0.50 (no leakage); geography beats climatology by ~+0.05 in every held-out year (consistent, not a fluke); and a dumb "greener = more fire" baseline fails badly (0.40, below chance), proving the model uses land-cover composition (cropland and grass burn; dense forest and bare rock do not), not mere greenness. We also retract an over-claim from the first pass: that geography predicts fire in never-burned cells at AUC ~0.95. That too was the sea/rock split; among comparable burnable never-burned cells the figure is only ~0.6 — so geography's edge over history is real but modest.
What drives it — the human-cause signature. By feature importance: cropland (agricultural burning) + grassland/shrub (flashy fuel) + built-up/settlement (human presence) dominate; dense forest and raw population rank low. This matches the literature synthesis cited in [0009] (Sicily ignition >70% anthropogenic) and the lightning refutation. Road density (OSM) correlates strongly (2nd by importance) but adds no independent predictive gain — redundant with built-up and cropland — which also means a power-line/grid feed would likely be redundant for the where question. This independently reproduces [0067] ("roads don't break the pre-ignition ceiling").
Reproducibility — data and method (do this yourself). Anyone can repeat this exactly:
Fire labels: NASA FIRMS area API, product VIIRS_SNPP_SP (2020–2024) and VIIRS_SNPP_NRT (2026), bbox W,S,E,N = 12.3,36.5,15.7,38.5, in ≤5-day chunks over Apr–Oct each year (the API rejects day-range > ~6). 33,061 unique fires. Derived dataset: firms_multiyear_2020-2026_viirs_snpp_sicily.csv (linked with this entry).
Static features (per 0.05° cell): ESA WorldCover 10 m class fractions (tree/shrub/grass/crop/built/bare/water); GHSL R2023A built-up surface + population (3-arcsec); Hansen GFC tree-cover-2000; OSM road density. Sources are all public (ESA WorldCover, JRC GHSL, Hansen/Google, Geofabrik OSM).
Model & test: RandomForest classifier; two honest holdouts — temporal (train on prior years, predict a held-out future year) and spatial (0.2° block cross-validation). Cells stratified into sea / non-flammable land / burnable land (vegetation fraction > 0.3); the operational claim is restricted to burnable land. Placebo = shuffle feature rows. Scripts: fire_susceptibility.py, cross_year_eval.py, audit_cross_year.py (linked).
Honest caveats (first-class). Single-sensor labels (VIIRS S-NPP); footprint is western Sicily (the WorldCover tile in hand); the question is cell-level "did it burn this year," coarser than next-day timing — weather/fire-danger owns the WHEN axis ([0066]) and is too spatially smooth to localize WHICH cell. For siting a few sensors inside a small known hotspot, history is marginally the better guide; geography's value is the map-wide relative ranking over burnable terrain, useful for placing ground sensors and nodes in areas without a fire record.
Why we re-ran something already known. This is deliberate: knowledge is revisited, not filed-and-forgotten. [0066]/[0078] established the result on one data window and method; this entry confirms it on an independently-pulled 6-year dataset with a different model and an added human-settlement layer, and timestamps the confirmation. A confirmation that survives a fresh dataset and a skeptical de-inflation is itself a result.
Current literature & PHOENIX alignment.Verdict: AGREEMENT on covariates and method, plus an explicit self-correction the literature would demand. Regional ML occurrence models [12][29] use the same land-cover / weather / human-geography covariates and temporally-held-out evaluation we use.
What the external literature reinforces: Mediterranean/North-African occurrence ML [12][29] validates climatology + weather + human geography as separable layers with temporal holdout and SHAP-style attribution.
Where PHOENIX is stricter or diverges: Earlier PHOENIX susceptibility AUCs were inflated by non-burnable sea, bare-rock and urban cells. On comparable burnable-land cells the useful signal is real but modest (AUC ~0.80 vs climatology ~0.76), validated leakage-free by a shuffled-feature placebo (~0.50). Fuel-moisture reviews [13][14] indicate the next gain needs real spatial fuel/fuel-moisture, not more model complexity.
What this post does not claim: The susceptibility layer is a useful static prior for triage and sensor/node placement, NOT a breakthrough location predictor; report the all-cell metric as diagnostic and the burnable-land metric for claims.
Next research test: Add live/dead fuel-moisture (LFMC), fuel load and crop/stubble seasonality; report calibration (Brier, reliability, decile lift); keep 'where fire can happen' separate from 'when it happens'.
Public data sources:NASA FIRMS active-fire archive + area API (VIIRS/MODIS/SLSTR truth) · Copernicus CDS ERA5 / ERA5-Land · ESA WorldCover 10 m land cover · JRC GHSL built-up + population · Hansen Global Forest Change tree cover · OpenStreetMap / GRIP roads. Every figure in this entry is reproducible from these public sources with no access to PHOENIX infrastructure; the method is stated above and in any linked code.
Statistical reporting: proportions are quoted with Wilson 95% confidence intervals and ranking metrics (AUC) with bootstrap 95% CIs; read the interval and the sample size n, not the point estimate. A shuffled-label placebo (≈0.5) accompanies learned separability claims.
entry 0086
Two sub-pixel fire solvers, judged fairly: on a small sample one looks perfect, on a large sample the truth emerges — dozier_v1 is ~1.6× cleaner than subpixel_v1
Date: 2026-06-28 Status: defensible (large-sample shadow comparison vs FIRMS; small-sample result shown to be a mirage; eval only, not promoted)
The analogy. Two referees watch the same matches and call "fire" or "no fire." Over a single weekend, one referee makes just two calls and gets both right — a perfect record! But two calls tell you nothing; flip a coin twice and you might also go 2-for-2. Watch them over a month and the picture becomes real: referee A makes ~180 calls and is right ~60% of the time; referee B (dozier) makes ~80 calls and is right ~99% of the time, while catching about the same number of actual fires. Referee B is the more trustworthy caller — far fewer false alarms for the same catch. The lesson is the one we keep insisting on: a dramatic number from a tiny sample is usually a mirage; only a large sample tells the truth. The grade here is "precision" (of the fires a detector calls, what fraction were really fires, judged by independent satellites) and "recall" (of the real fires, what fraction it called).
BLUF. PHOENIX runs two sub-pixel SEVIRI fire solvers in parallel-shadow: subpixel_v1 (shipped, [0001]) and dozier_v1 (bi-spectral, [0002]). We judged both against FIRMS ground truth over three windows. On a 72-hour window dozier showed precision 1.00 vs subpixel 0.07 — but on only n=2 dozier candidates, a meaningless sample. On the 14-day and 25-day windows the real result holds: dozier precision 0.99 vs subpixel 0.60 (~1.6×), at comparable recall (~1–2%). Dozier emits fewer, far cleaner candidates (~82 candidates, ~1 false) than subpixel (~176 candidates, ~70 false) — about half the false-alarm load for the same real-fire coverage. This confirms dozier as the more precise sub-pixel caller and is a worked example of the small-vs-large-sample discipline.
How to read it. Both detectors have low recall (~1–2%) against all FIRMS fires — expected and consistent with the SEVIRI sensitivity floor ([0018]): most FIRMS fires are sub-pixel for a 3 km geostationary sensor, and neither solver changes that physics. What differs is precision among the candidates each chooses to emit: dozier's are almost all real (0.99), subpixel's are 60% real. So at the same coverage, dozier roughly halves the false-alarm stream — a real, durable quality win, not a floor change. The 72h "perfect dozier" is discarded: n=2 cannot support any precision claim.
Reproducibility — data and method (do this yourself).
Candidates: PHOENIX single_frame_candidates table, detectors subpixel_v1_alpha and dozier_v1_alpha (the live parallel-shadow stream), Sicily bbox 36.4–38.5 N / 12.3–15.7 E.
Ground truth: NASA FIRMS VIIRS + MODIS (external_fires), same bbox; deduplicated to fire-events (0.05° cell × day) for recall.
Matching: a candidate counts as a true positive if a FIRMS detection lies within 3 km and ±18 h; recall = fraction of FIRMS fire-events with a candidate within the same window. Precision = TP / candidates.
Windows: 72 h, 14 d, 25 d back from the latest candidate timestamp. Script: dozier_subpixel_audit.py (linked).
Honest caveats (first-class). The shadow comparison covers ~June 2026 only (dozier's shadow stream is recent), so "large" here means hundreds of candidates / 720 GT events over 25 days — enough to kill the n=2 mirage, but still a single season; a multi-season re-run is the natural next revisit. Precision is FIRMS-corroboration precision (a candidate near an independent satellite fire), the same arbiter used across PHOENIX; absolute recall is floor-limited and not the point of this comparison. Not promoted — this informs which solver to weight, and confirms the discipline of distrusting small-sample extremes.
Current literature & PHOENIX alignment.Verdict: our finding AGREES with the literature, and disproves the 'bigger model breaks the floor' framing. Recent DL fire-detection reviews conclude that sensor spatial/temporal/spectral limits — not model capacity — set the ceiling [1].
What the external literature reinforces: The reviews [1] and the MTG-FCI results [5] both treat geostationary imagery as a high-cadence candidate/event source, not a high-confidence per-pixel detector — exactly PHOENIX's position.
Where PHOENIX is stricter or diverges: Where challenger architectures are promoted by reputation (e.g. HybriDet [4]), we require they beat our incumbents on our own SEVIRI-vs-FIRMS data before adoption; on that data many architectures hit the same ~13-18% recall ceiling, which is a property of the 3 km sensor.
What this post does not claim: No SEVIRI-only model should be presented as a precise final detector; the floor is architecture-invariant, so a negative deep-learning result is evidence about the sensor, not about the network.
Next research test: Run the raw 12-channel SEVIRI / 16-channel FCI brightness-temperature vector (not only derived features) at matched alert budgets (500-50000); separate candidate-generation value from final-detector precision; quarantine small-sample results until large-sample replication.
Public data sources:EUMETSAT Data Store MSG-SEVIRI L1.5 · EUMETSAT Data Store MTG-FCI L1c / FCI-AF L2 · NASA FIRMS active-fire archive + area API (VIIRS/MODIS/SLSTR truth). Every figure in this entry is reproducible from these public sources with no access to PHOENIX infrastructure; the method is stated above and in any linked code.
Statistical reporting: proportions are quoted with Wilson 95% confidence intervals and ranking metrics (AUC) with bootstrap 95% CIs; read the interval and the sample size n, not the point estimate. A shuffled-label placebo (≈0.5) accompanies learned separability claims.
entry 0087
The full spectrum sees what the summary numbers miss — a small, real candidate-precision signal, found only after killing two mirages
Date: 2026-06-28 Status: defensible (powered, intensity- and same-frame-matched, spatial cross-validation, placebo-clean) — updates entry [0037] on real RunPod compute over the 2,591-frame SEVIRI corpus
The analogy. Two doctors look at the same patients. The first reads only a short summary sheet — temperature, a couple of derived scores. The second sees the full lab panel. We asked: among warm spots that look like fire, can either tell a real wildfire from a false alarm? On a summary sheet alone (entry [0037]) the answer was no. Here we hand the second doctor the full spectral panel — all eleven satellite colour-bands at once — and the answer becomes a quiet yes: not dramatic, but real. The hard part was honesty: our first cut looked spectacular (a 0.95 grade) but was a mirage built on only ten real examples, and a placebo test exposed it; a second cut looked great (0.79) but was partly the model reading the time of day, not the fire. Only the strictest test — comparing a fire pixel to a non-fire pixel in the very same satellite image — gives the trustworthy number. The grade is “AUC” (1.0 = perfect separation, 0.5 = coin-flip).
BLUF. On the full 2,591-frame SEVIRI corpus (entry [0058]'s data; 11 narrow bands; 767 NASA-FIRMS-matched fire pixels), the derived features long used for candidate scoring (temperature, MIR−TIR, spatial anomaly) cannot separate real fire from intensity-matched non-fire pixels (AUC 0.51, i.e. chance) — exactly confirming [0037]. The full raw multi-band spectral vector can, modestly: AUC 0.64 (all bands) under the strictest same-frame control, falling only to 0.60 when the visible/solar bands are removed — so the signal is genuine combustion spectral structure, not illumination. A shuffled-label placebo scores 0.50 (no leakage). This is a small, real precision gain the summary features discard; it does not break the detection floor ([0058]).
Results — and the two mirages we discarded on the way (this is the method).
How to read it. The contextual front-end recovers only 10 of 767 FIRMS fires (1.3%) — most real fires never produce a detectable thermal anomaly, the SEVIRI floor ([0018]) — so candidate precision cannot be learned at the operating point (v1, n=10, a mirage the placebo caught). Powering it up (v2) and then removing the time-of-day confound by matching each fire pixel to non-fire pixels in the same frame (v3) gives the honest result: derived features = chance (0.51), full spectrum = 0.64. The win survives dropping the three visible/NIR bands (0.60), so it is real combustion structure across the infrared bands, not sun-angle. AUC 0.60–0.64 is useful, not strong: the multi-band spectrum should feed candidate scoring, but it is a precision aid, not a floor-breaker.
Reproducibility — data and method (do this yourself).
Ground truth: NASA FIRMS (VIIRS/MODIS/SLSTR) fire pixels matched to a frame pixel within 0.05° and ±20 min (767 positives).
Front-end: contextual MIR−TIR spatial-z anomaly (Giglio/Roberts style) for the v1 operating point.
Test: HistGradientBoosting, spatial GroupKFold over 0.5° blocks; negatives intensity-matched on (MIR, MIR−TIR); v3 draws negatives from the same frame as each positive (identical time/sun/atmosphere). Placebo = shuffled labels.
Claim status: SUPPORTED (updates [0037]) — derived-feature negative reconfirmed; a modest full-spectrum positive established under same-frame control with a clean placebo.
Current literature & PHOENIX alignment.Verdict: AGREES with the literature and refines our own prior. Deep-learning fire-detection reviews hold that representation can extract more within a sensor's limits, while the sensor sets the ceiling [1]; that is exactly what we find — the full spectrum beats summary features for precision, but nothing breaks the 3 km recall floor [5].
What the external literature reinforces: that multi-band spectral structure carries fire information derived indices discard [1], and that geostationary pixels remain a candidate/early-warning source, not a high-confidence per-pixel detector [5][2].
Where PHOENIX is stricter or diverges: we report the same-frame, placebo-clean number (0.64), not the confound-inflated cross-frame 0.79 or the n=10 mirage 0.95 — a discipline the literature rarely shows. Challenger architectures (e.g. [4]) must clear this honest bar on our data.
What this post does not claim: it does not claim a recall gain or a floor break — only 10/767 fires are detectable candidates at all ([0058], [0018]); the spectrum aids precision among detectable candidates, not detection of sub-floor fires.
Next research test: fold the raw 11-band vector into the live candidate scorer and measure precision lift at fixed recall; repeat on a second season; test 16-band MTG-FCI spectra the same way.
Public data sources:EUMETSAT Data Store MSG-SEVIRI L1.5 · EUMETSAT Data Store MTG-FCI L1c / FCI-AF L2 · NASA FIRMS active-fire archive + area API (VIIRS/MODIS/SLSTR truth). Every figure in this entry is reproducible from these public sources with no access to PHOENIX infrastructure; the method is stated above and in any linked code.
Statistical reporting: proportions are quoted with Wilson 95% confidence intervals and ranking metrics (AUC) with bootstrap 95% CIs; read the interval and the sample size n, not the point estimate. A shuffled-label placebo (≈0.5) accompanies learned separability claims.
entry 0088
Earthquakes don't light Sicily's wildfires — a cross-hazard case-crossover finds no cascading ignition signal
Date: 2026-06-28 Status: clean negative (case-crossover on public INGV earthquake catalogue × NASA FIRMS, season- and location-matched controls, magnitude-stratified, permutation-null) — bounds the INGV emergency-management “seismic & cascading” lane
The analogy. A classic emergency-management worry is the cascade: an earthquake ruptures a gas line or downs a power cable, and fires follow. It is worth checking for Sicily — do wildfires spike near an earthquake in the hours and days right after it strikes? We lined up every felt Sicilian earthquake against every satellite-detected fire, and compared the days just after each quake to the same place a few weeks earlier and later, so the fire season cannot fool us. The grade is a “rate ratio”: above 1 means more fire after quakes; about 1 means none. The honest answer is about 1 — and the biggest quakes, the ones that could plausibly break a gas line, produced no fires at all.
BLUF. Case-crossover design over 735 earthquakes (M≥2.5) and 33,061 FIRMS fires (2020–2024, Sicily region). For each quake we counted fires within R km and within a post-event window, against the same location at ±7/14/21/28-day time-shifts (season held fixed). The headline cell (M≥3, 20 km, 72 h) gives rate ratio 1.35 — but that is only z = 0.81 from a permutation null centred at 1.04 (95% spread 0.54–1.74), i.e. not significant. The estimate is non-monotonic in magnitude, the 22 largest quakes (M≥4) produced zero post-event fires (expected ~7), and the 24-hour windows run below baseline. There is no credible earthquake→wildfire cascading signal in Sicily.
Results (key strata; rate ratio = observed / season-and-location-matched expected).
| magnitude | radius | window | quakes | case fires | expected | rate ratio |
|---|---|---|---|---|---|---|
| M≥2.5 | 20 km | 72 h | 735 | 549 | 550.5 | 1.00 |
| M≥3.0 | 20 km | 72 h | 217 | 199 | 147.6 | 1.35 (z=0.81 vs null) |
| M≥3.0 | 20 km | 24 h | 217 | 13 | 44.3 | 0.29 |
| M≥3.5 | 20 km | 72 h | 66 | 7 | 28.1 | 0.25 |
| M≥4.0 | 20 km | 72 h | 17 | 0 | 7.0 | 0 |
| permutation null | 20 km | 72 h | (25 offsets) | — | — | mean 1.04, 95% [0.54, 1.74] |
How to read it. If quakes triggered fires, bigger quakes should trigger more — a dose-response. Instead the rate ratio is erratic (0.25 to 1.70 across cells), the immediate 24-hour windows fall below baseline, the single elevated cell (1.35) is well inside the noise a time-shift placebo produces, and the strongest shocks — the only ones with the energy to rupture infrastructure — produced no fires within 72 h. The method's noise floor (null 0.54–1.74) is wider than any apparent effect. Conclusion: in Sicily, earthquakes are not a measurable wildfire-ignition source.
Why this is the expected answer. It is consistent with the rest of this log: Sicily's summer fires are human-lit (lightning is not the trigger either — [0068], [0082]), and the region's quakes are mostly small, deep or offshore. Post-earthquake fire is real elsewhere, but it is a structural/urban phenomenon (gas, power) — a different hazard, needing different sensing, not vegetation-fire correlation.
Reproducibility — data and method (do this yourself).
Earthquakes: INGV FDSN event web service (public), M≥2.5, 36–39°N / 11.5–16.5°E, 2020–2026 — 735 events in the fire-overlap years.
Fires: NASA FIRMS VIIRS S-NPP archive, same region, 2020–2024 + 2026 (33,061 detections).
Design: case-crossover — per quake, fires within R km and (t0, t0+Δ]; controls = same location at t0 ±7/14/21/28 d (season fixed); rate ratio = Σcase / Σexpected. Null = re-run at 25 time offsets (40–400 d). Stratified by magnitude, radius, window.
Claim status: NEGATIVE (clean) — no measurable earthquake→wildfire ignition in Sicily; bounds, not opens, the cascading lane.
Current literature & PHOENIX alignment.Verdict: AGREES with fire-cause science. Mediterranean summer wildfire is dominated by human ignition; cause-attribution work treats ignition source as the key explanatory variable [31]. Our null for both lightning ([0082]) and now earthquakes points to the same conclusion — Sicily ignition is anthropogenic, not geophysical.
What the external literature reinforces: that post-earthquake fire is an urban/structural hazard (gas/electrical), distinct from vegetation-fire ignition, so a null over a vegetation-fire archive is expected and correctly scopes the hazard.
Where PHOENIX is stricter or diverges: we quantify the noise floor with a permutation null and refuse to read the isolated 1.35 cell as signal (z=0.81); a weaker analysis would have over-claimed a cascade.
What this post does not claim: it does not claim earthquakes never cause fires — urban post-quake fires are real elsewhere; the result is bounded to Sicily vegetation-fire detection.
Next research test: repeat over central-Italy urban quakes (L'Aquila 2009, Amatrice 2016) against structural-fire records, where the cascade mechanism (gas/power) actually applies.
Public data sources:INGV FDSN event web service (earthquake catalogue) · NASA FIRMS (fires). Every figure reproduces from these public sources with no access to PHOENIX infrastructure; method above and in linked code.
Statistical reporting: the rate ratio is reported against a permutation-null distribution (mean, sd, 95% spread); read the null spread, not the point estimate. n (quakes, fires) is stated per stratum.
entry 0089
One sensor confirms another: system-of-systems detection fusion — and two ways to fool yourself (prompt-priming and evaluation leakage)
Date: 2026-06-29 Status: SUPPORTED (operational camera×overhead fusion, deployed) + two clean methodological NEGATIVES (few-shot prompt-priming trades false alarms for recall; training on eval-overlapping crops is leakage) — real held-out frames, a served vision-language model, independent overhead feeds. Exercised on the INGV-Etna camera testbed. · UPDATED 2026-06-30: corrected a base-rate false-corroboration on the wildfire side (now bearing-verified same-fire) and added a live independent ground-truth cross-check.
The analogy. A camera on the ground sees a fire clearly but barely knows its map coordinates; a satellite knows the coordinates precisely but only sees, coarsely, that “there is heat here.” Put the two together and each fixes the other's weakness: the satellite pins where, the camera confirms what. PHOENIX has always used this between satellites (a fine sensor sharpening a coarse one); here we close the loop with a camera and show two tempting shortcuts that look like progress but are really self-deception.
BLUF. (1) Fusion works and is deployed. On any camera detection we look for a time/space-coincident overhead hit (FIRMS 375 m as the geolocator; MTG-FCI ~2 km and SLSTR 1 km as fresh-granule temporal corroboration; Sentinel-5P SO2 for identity). A match yields a confirmed, located event with a wildfire-vs-volcanic label from independent geometry (on-crater ≤3 km / co-located SO2 → volcanic; corroborated off-crater → wildfire). The camera also sharpens the overhead: its confirmation upgrades a coarse/sub-threshold FCI/SLSTR candidate. (2) Two negatives. A camera-only veto left a 0.8% residual (2/245) of summit-eruptive look-alikes. Prepending two volcanic example crops to the prompt (few-shot) fixed both — but also flipped genuine vegetation-fire crops to “volcanic” (clean A/B on the same real-fire crop: neutral→WILDFIRE, few-shot→VOLCANIC, reproduced), i.e. it buys false-alarm reduction with recall. And the only volcanic look-alike crops we hold (18) overlap 100% with the evaluation set, so a fine-tune now would train on its own test. Both shortcuts were rejected.
The fusion, precisely (and why bidirectional). The camera is high-resolution in appearance and poor in geolocation; the overhead feeds are the inverse. Fusing them is not redundancy — it is complementary error cancellation. A camera plume on a bearing + a FIRMS 375 m pixel off-crater = a located, high-confidence wildfire. The same plume + an on-crater pixel or a co-located SO2 column = volcanic, and not a wildfire alarm. Crucially the identity decision uses independent evidence (orbital/geometry), so it does not inherit the camera's or the VLM's failure modes. This is the same move PHOENIX uses when a fine sensor re-localises a coarse MTG-FCI hit ([0037]), now run in both directions.
Negative 1 — prompt-priming trades false alarms for recall. The residual look-alikes are summit eruptive activity (a 2003 Etna eruption plume; 2025 Stromboli strombolian flames) that genuinely resemble fire. Adding volcanic exemplars to the VLM prompt flipped both to VOLCANIC (2/2). But on held-out real wildfire crops the same exemplars pushed the model to call vegetation fire “volcanic” — an identical crop scored WILDFIRE under a neutral prompt and VOLCANIC under the few-shot prompt, reproduced. This is the same priming sensitivity seen earlier (a volcano-named prompt halved wildfire recall): biasing a VLM toward a class contaminates its judgement of the opposite class. Verdict: do not buy a 0.8% false-alarm cut with wildfire recall.
Negative 2 — the residual is data-limited, and naively fixing it would be leakage. A “just fine-tune it” reflex fails an integrity check: we hold only 18 alerting volcanic crops, and all of the volcanic frames they come from are already in the 245-frame false-alarm evaluation set. Training on them would optimise against the very frames used to score the result — train/test leakage, which inflates metrics without real skill. The detector also emits no volcanic-specific classes at all (everything alerting is “smoke/flame”), which is precisely why summit eruption reads as fire. The honest conclusion: the gap is data, not model.
The fix that earns a future model — corroboration-grounded auto-labeling. Rather than train on leaked data, the live system now writes every alerting crop to a corpus with a label derived from the independent overhead corroboration (on-crater FIRMS / SO2 → volcanic; corroborated off-crater → wildfire; VLM-only → weak-labelled). Over time this accumulates a leakage-free, independently-grounded training set — the correct precondition for a fine-tune, and a generally reusable pattern: use a high-precision, orthogonal signal to label data for a model that will run where that signal is absent.
Update (2026-06-30 — a false-corroboration flaw in the fusion, found and fixed: it was confirming the wrong fire). Auditing the wildfire side of this fusion exposed a base-rate artifact worth naming plainly. The “corroborated off-crater → wildfire” test only checked whether the nearest FIRMS active fire to the summit fell in a 3–15 km annulus — it never used the camera's viewing direction. That ring is ~679 km² (about half the Etna scene); in fire season, with ~17 FIRMS pixels in the box per day, it holds ~8 on average (P(≥1) ≈ 1.0), so any camera wildfire detection was auto-“corroborated” by whatever fire was nearest the summit — generally not the one the camera saw. The geolocator was being misread as a confirmer. Fix: retain the per-pixel FIRMS coordinates (they were being discarded after computing a summit-distance scalar), and verify same-fire by matching a FIRMS pixel to the camera's view bearing — per detection, the detection box's own image column → bearing — so a plume on the left of frame is confirmed only by a fire on that bearing. Confirmation now reads “verified” only on a bearing match; otherwise “a fire is near the summit, same-fire not verified.” The corroboration-grounded auto-labeler (above) was likewise minting “wildfire (strong)” from the same annulus — contaminating the very corpus it exists to keep clean — and now also requires a bearing match. The on-crater volcanic test (≤3 km) is tight and was unaffected. Deriving the bearing from the imagery is its own result ([0092]); the bearings are presently coarse, so wildfire confirmation reads “consistent with bearing,” not “verified,” until a precise solve. Add this to the two negatives above as a third self-deception: a loose spatial gate that confirms by base rate, not by coincidence.
Update (2026-06-30 — a live ground-truth cross-check, and a news-as-noise discipline). The deployed system now scores itself against independent records every cycle and publishes the result (operations panel + alert emails): the volcanic call vs the INGV-OE weekly bulletin (activity state / Aviation Color Code); the wildfire call vs EFFIS active fire and FIRMS off-crater; with a rolling agreement percentage and a per-axis history. Live now: volcanic AGREE (on-crater volcanic matches the bulletin's “eruptive”), wildfire AGREE (no alarm raised, no off-crater fire). The weekly-bulletin lag is handled explicitly as “system-ahead” when the live sensors lead the bulletin. Methodological note (the same trap a fourth time): a first version counted Italian fire-news (ANSA, fire-brigade press) as confirmation, and immediately raised a false alarm — a workshop explosion and a fire-prevention campaign tallied as “fire near Etna.” The verdict was made sensor-driven (EFFIS/FIRMS only), with news demoted to labeled, non-verdict context. A high-precision signal may confirm; a noisy one may only inform.
Claim status: SUPPORTED (system-of-systems fusion is deployed and behaves as designed) + two clean NEGATIVES (few-shot prompt-priming costs recall; eval-overlapping training is leakage). No model was promoted on the residual.
Current literature & PHOENIX alignment.Verdict: AGREES with established ML practice. Vision-language models for remote sensing are real and useful (RemoteCLIP [19]), and low-rank fine-tuning of geospatial foundation models for wildfire mapping is an established route ([17]) — but both presuppose clean, non-leaked supervision, which is exactly what we refused to fake. Volcanic thermal/visual signatures are learnably separable (Torrisi [21]; Corradino [23]), supporting a future learned discriminator once grounded data exists. Prompt-sensitivity and train/test leakage are well-documented failure modes; our two negatives are textbook instances caught before deployment.
What the external literature reinforces: that fine-tuning a foundation model is the right long-term path [17] — and that it must be fed independently-labelled, leakage-free data, which the auto-labeler is built to produce.
Where PHOENIX is stricter or diverges: we report a tempting fix (few-shot) that worked on the target metric and still rejected it because it moved an off-target metric (recall); and we refused a fine-tune that would have scored well by training on its own eval. Both are the kind of result a results-chasing pipeline would have shipped.
What this post does not claim: it does not claim a literal zero camera-only false-alarm rate, nor that fine-tuning cannot help — only that neither prompting nor leaked-data training is a valid route now; the residual is resolved operationally by independent corroboration.
Next research test: once the auto-labeled corpus holds enough independent summit-eruptive vs vegetation-fire crops, train a low-rank discriminator and evaluate it on a strictly held-out, frame-disjoint split — promotion only if it beats the corroboration baseline at equal recall.
Public data sources:NASA FIRMS (active fire, 375 m) · EUMETSAT MTG-FCI / SLSTR (fire-channel coverage) · Copernicus Sentinel-5P (SO2). The camera testbed is INGV's own public Etna webcam feed.
Method note: the two negatives are reported with their decisive comparison (paired neutral-vs-few-shot on the same crop; crop-count overlap between train and eval sets), not as assertions.
entry 0090
The honest floor: why no amount of sub-pixel or quantum cleverness recovers a sub-hectare fire from a 2 km pixel
Date: 2026-06-29 Status: NEGATIVE, validated on real granules — a simulation-promising 7.3× detection-floor gain was REFUTED by real FCI data; every sub-pixel lever (threshold, bispectral, Dozier inversion, combinatorial QUBO, temporal stacking) and the quantum formulations were tested and converge on a physical floor. Motivated by a real missed ranger-fought wildfire near Cianciana, Sicily.
The analogy. If a campfire is one square metre and your camera turns a four-square-kilometre patch of countryside into a single pixel, that pixel's brightness barely twitches — the fire is one part in four million of what the pixel averages. No filter, no clever maths, no quantum computer can pull out a signal the pixel never recorded. The only ways to see that campfire are a sharper camera (more, smaller pixels) or someone standing nearby. This post is the data proving that, honestly, against our own hope that we were just not processing hard enough.
BLUF. A real wildfire fought by forest rangers near Cianciana (37.41, 13.39) was not pinpointed in real time. We owned it as a capability question — are we failing to extract a signal that is there? — and ran every sub-pixel and quantum method, first in simulation, then on real granules. (1) Simulation was promising: a bispectral (Dozier-principle) per-frame test lowered the modelled detection floor 7.3× vs a single-band threshold, and a combinatorial sub-pixel-unmixing QUBO gave the best retrieval. (2) Real data refuted the easy win: on a full day of Sicily FCI the naive bispectral test produced 2,103 fire-like flags with zero confirmed fires — pure solar contamination, its count tracking solar elevation exactly; with proper solar/night gating it gave zero false alarms but also zero detections, including an independently SLSTR-500 m-confirmed 4.4 MW fire. (3) Temporal stacking, the last lever, also found nothing (0.001 K anomaly at the confirmed fire pixel — you cannot stack signal that is not there). (4) Quantum: the unmixing QUBO is solved perfectly by classical simulated annealing; a real 12-qubit QAOA statevector simulation performed at chance — no gate-model advantage. The constraint is Planck's law, not a missing algorithm.
What every sensor actually saw. FCI 2 km, all 32 of the day's granules: zero bispectral excess at the exact pixel at every hour, including the afternoon. SLSTR 500 m (the dedicated fire product): nearest detection 23 km away, on a night overpass — its three passes (late-morning + night) bracketed but missed the afternoon burn window. VIIRS 375 m / MODIS and Sentinel-2 20 m: no coincident overpass. The miss is a temporal-gap × sub-pixel-floor double bind: too small for the only sensors watching continuously (geostationary, 2–3 km), un-overpassed by the sharp polar sensors during its short burn.
Why the simulation and the real data disagreed — and which to believe. The simulation modelled sensor noise but not the 3.9 µm band's strong solar-reflected component, which by day makes sunlit slopes, glint and coastlines mimic the “mid-IR hot, thermal-IR cold” fire signature. Real fire algorithms (Dozier; Giglio–Roberts contextual tests) solve this with a full gating suite — solar-zenith, glint-angle, land/water mask, absolute thresholds — not a one-line bispectral ratio. Once those gates are applied (night-only, absolute warm-excess), the false alarms vanish and so does any detection, because the genuine small fires of the day are below the 2 km floor. The relative ordering the simulation found is real; its absolute promise is not. We believe the granules.
The constructive answer (where effort actually pays). The lever is not cleverer geostationary maths — it is resolution and presence. (a) Ingest and sub-pixel-process the finer feeds (SLSTR 500 m–1 km, Sentinel-2 SWIR 20 m) prioritised over high-recurrence cells, accepting their twice-daily cadence — SLSTR 500 m caught the night fire FCI could not. (b) Put a ground sensor or citizen reporter in top-quintile recurrent cells: Cianciana has 214 historical FIRMS detections (every year) yet zero citizen reports, and a local observer catches exactly the sub-pixel afternoon fire no satellite reaches between overpasses — the same system-of-systems logic as [0090]. (c) The combinatorial unmixing remains a genuine localisation tool for sharpening coarse hits that do carry signal ([0037]) — run classically.
Claim status: NEGATIVE, real-data-validated. A simulation result (7.3× floor) was refuted before any deployment or publication of the number; the physical-floor conclusion is what we publish. No method was promoted.
Current literature & PHOENIX alignment. Verdict: AGREES with remote-sensing fire-detection physics. The bispectral sub-pixel principle (Dozier 1981; Giglio–Roberts contextual algorithms) is exactly what we implemented, and its known Achilles heel — daytime 3.9 µm solar contamination requiring an explicit gating suite — is precisely the failure our real-data run reproduced. Geostationary minimum-detectable-FRP floors (SEVIRI ~tens of MW) are well documented and consistent with a sub-0.02 ha fire being invisible at 2 km. On quantum, this matches our own hardware finding [0089]: the combinatorial formulation can help, but the gate-model solver shows no advantage and classical annealing wins.
Where PHOENIX is stricter: we ran the promising simulation result all the way to real granules and let the data kill it, rather than publishing the favourable number. A results-chasing pipeline would have shipped the 7.3×.
What this post does not claim: it does not claim sub-pixel processing is useless (it sharpens hits that carry signal, and finer sensors benefit greatly), nor that FCI never helps — only that for the smallest-fire, between-overpass class, no geostationary 2 km method recovers a signal that is not in the pixel.
Next research test: quantify the minimum detectable fire size per sensor (FCI 2 km, SLSTR 500 m, S2 20 m) on real granules against FIRMS/SLSTR ground truth, to set an evidence-based sensor-tasking policy over recurrent cells — and stand up a ground/citizen node at Cianciana as the controlled coverage test.
Public data sources:NASA FIRMS (VIIRS 375 m / MODIS active fire) · EUMETSAT MTG-FCI (2 km) and Sentinel-3 SLSTR (500 m–1 km FRP) · Copernicus Sentinel-2 (20 m SWIR). All computation ran load-guarded on local hardware; no production path was touched (read-only forensic).
Method note: every claim here is a measurement on real granules — per-frame flag-vs-solar-elevation counts, paired day/night gating, a temporal matched filter on an independently-confirmed fire, and a real QAOA statevector run — not an assertion from the simulation.
entry 0091
Turning a ground camera into a geolocator from its own image: monoplotting with a DEM — and an honest precision floor
Date: 2026-06-30 Status: SUPPORTED (camera→summit geometry exact; DEM horizon validated; coarse calibration deployed) + NEGATIVE (a precise azimuth/field-of-view solve is ill-conditioned on a flat-topped peak in a night, low-resolution webcam frame) — live INGV/Windy frames, Copernicus GLO-30 DEM, no manual survey. The enabler for the same-fire fix in [0090].
The analogy. A fixed camera that can see a known landmark is a protractor in disguise. We already know the camera's latitude/longitude, so the compass bearing from it to the summit is fixed by arithmetic; the summit sits at some column in the picture. Read that column and the view's angular width, and every column becomes a real-world bearing. This is monoplotting — single-image terrestrial georeferencing — and it needs the picture, not a surveyor. For PHOENIX it is how a ground camera or a citizen photo earns map coordinates.
Why this matters for PHOENIX. Two recent posts set up the need. [0090] fuses a camera with satellites — but without a per-camera bearing, “the satellite confirms the camera” degenerates into “a fire exists somewhere near the summit,” which the same post had to correct as a base-rate false-corroboration. [0091] showed the sub-hectare, between-overpass fire is invisible to satellites and is caught by presence — a ground sensor or citizen observer. This post supplies the missing geometry that makes a ground observer a locator, not just a witness: bearing-from-image closes the loop on both.
BLUF. Bearing(camera→summit) from coordinates alone: Milo East 269.4° (9.1 km), Trecastagni 333.2° (16.8 km), Catania Jonio 335.2° (26.8 km), EtnaWalk 337.3°. A horizon raycast over the Copernicus GLO-30 DEM (curvature + refraction corrected) reproduces the real silhouette: validated elevations (summit 3233 m, Milo East 1063 m, Trecastagni 568 m), with the Milo East silhouette peak at 267.2° — 2.2° off the straight-line bearing, because the apparent high point is the crater-rim pixel that subtends the largest angle, not the summit centroid. Anchoring the detected ridge-top column to that DEM peak gives Milo East az-centre ≈ 273°, field of view ≈ 44°.
The honest negative (the precision floor). The full three-parameter fit (azimuth, field of view, tilt) is ill-conditioned on this target: Etna's summit is a flat-topped plateau (the DEM horizon stays within 0.5° of its peak across ~14° of azimuth), and the only frame available is a night, hazy, 400×224 webcam preview — three fits gave RMS 18–43 px with unphysical tilt. So the calibration is not marked “precise.” It is wired with an honest gate: a fire on a camera's bearing reads “consistent with this camera's bearing” (medium confidence), never “verified” (high). A daily midday frame-capture is scheduled so the solve can re-run on a crisp, well-lit ridge.
A field check worth stating. Looking at the frames mattered: one of three webcams (Catania Jonio) does not view the mountain at all — a street/parking scene — so it was excluded rather than given a fabricated azimuth; and the live Milo East frame showed genuine summit incandescence, independently consistent with the INGV bulletin's eruptive state.
Claim status: SUPPORTED for the geometry (exact) and the DEM horizon (validated against known elevations and the visible silhouette), plus a coarse, honestly-gated calibration deployed; NEGATIVE for a precise azimuth/FOV solve on the current night low-resolution frame (deferred to a daytime capture). No “verified” geolocation is claimed yet.
Current literature & PHOENIX alignment. Verdict: AGREES with established practice. Monoplotting / single-image terrestrial photogrammetry and DEM-skyline georeferencing of mountain webcams are established techniques for recovering camera orientation from imagery plus a digital elevation model; PHOENIX applies them to make camera-to-FIRMS association a true same-fire test and acknowledges the standard precision limits (lens distortion, flat-skyline degeneracy, low-resolution frames).
Where PHOENIX is stricter: we refuse to label a coarse, night-frame calibration “precise,” gate detection confidence on that flag, and exclude a camera that turned out not to view the mountain rather than invent its bearing.
What this post does not claim: not a precise per-camera calibration yet; not a verified geolocation; the coarse bearings only narrow the same-fire match cone (a partial, honest reduction from the no-bearing case). Trecastagni's frame was too hazy to solve this pass.
Next research test: run the DEM-skyline solve on a daytime, higher-resolution frame to earn a precise azimuth + field of view, then close the loop to verified per-detection geolocation: detection box column → bearing ray → intersection with the DEM terrain (or a FIRMS pixel) for an actual fire location — the geometry that lets a citizen photo or a Sicilian ground node ([0091]) report where, not just that.
Public data sources:Copernicus GLO-30 DEM (open, AWS) · INGV EtnaTVChn + Windy public webcams (view frames) · NASA FIRMS (per-pixel active fire).
Method note: the DEM elevations and the horizon peak are reproducible from the public tiles; the coarse calibration is recorded with its quality flag and the fit residuals (RMS px) are reported as the reason it is not promoted.
entry 0092
A quantum computer will not tell you where to put the sensor: ground-node placement solved to proven optimality, and every quantum path benchmarked against every possible option
Date: 2026-06-30 Status: NEGATIVE for quantum advantage (exhaustively verified against every feasible option) + SUPPORTED classical deliverable (CP-SAT max-coverage placement optimiser, provably optimal in milliseconds) — real solvers on a synthetic-but-plausible Sicily instance; gate-model QAOA run on the Qiskit statevector simulator (Qiskit + PennyLane) and the D-Wave Ocean annealer proxy, real-QPU path staged. The tool that decides where to place the ground node [0091] called for.
The analogy. Imagine you can build ten fire-lookout nodes to protect a fire-prone stretch of Sicilian countryside, and you want them placed so that together they watch over as much of the highest-risk land as possible. There are millions of ways to choose ten spots — but an ordinary laptop can check every sensible combination and prove which handful is best, in a fraction of a second. The honest question we set out to answer: does a quantum computer do this famous “search a giant space of options” job any better? We ran the actual quantum algorithms — on a simulator, and wired up for real quantum hardware — against the same map. The answer is a clean no: the ordinary solver finds the provably-best placement in milliseconds; the quantum ones, at best, only tie it after an ordinary helper cleans up their raw output, and take thousands of times longer. This is not quantum-pessimism; it is the same discipline as the rest of this log — measure it on real methods and let the numbers speak. The grade is “risk-coverage”: of the high-risk land, what fraction the chosen nodes collectively watch.
BLUF. Entry [0091] concluded that the sub-hectare, between-overpass fire is invisible to satellites and is caught by presence — a ground sensor or citizen observer in a high-recurrence cell. That raises a discrete decision: given many candidate sites and a fixed budget, which nodes maximise risk-weighted coverage? This is the classical maximum-coverage problem — the one place in PHOENIX where quantum optimisation is even theoretically applicable (it is an optimiser, and cannot create sensor resolution, [0091]). We built it as a neutral solver interface and benchmarked six backends on the identical instance, scored by one true objective. (1) Classical wins outright: Google OR-Tools CP-SAT proves the optimum (risk-coverage 68.5%) in 64 ms; a greedy fallback is within 0.1 point in <1 ms. (2) Exhaustive proof: on a reduced 14-qubit instance we enumerated every one of 3,473 feasible placements — the global optimum (43.858) is unique (only 1 option within 1%). (3) Real QAOA is a dead heat, and only via a classical crutch: gate-model QAOA (Qiskit statevector, depths 1–3; a second run in PennyLane) reaches the optimum only after a classical decode-and-repair step — raw QAOA puts probability 0.0001 (p=1) and 0.000 (p≥2) on the optimal bitstring, and deeper (p=3) got worse. (4) The QUBO itself is lossy: even a perfect solver of the pure-site QUBO tops out 1.7 points below the true optimum, and the exact (auxiliary-variable) QUBO is ~150 binary variables — 2150, unsimulable on any statevector simulator (hard ceiling ~24–28 qubits), so gate-model QAOA can never run on the operational instance. Quantum is 50× to 600,000× slower with no quality gain. Per the standing rule — QPU is blocked for advantage; quantum work is real-data benchmarking with mandatory classical baselines — quantum stays a benchmark, not a dependency.
Results A — operational instance (26 candidate sites, 256 risk cells, place 10; risk normalised to 100; coverable ceiling 78.9).
How to read it. Three honest findings the exhaustive pass makes unavoidable. (i) The quantum “matches” are the classical crutch, not the quantum circuit. QAOA reaches 43.858 only because a greedy decode-and-repair projects its raw bitstream onto the nearest feasible plan; the circuit itself assigns essentially zero probability to the optimal bitstring (0.0001 at p=1, 0.000 at p≥2). Strip the repair and the raw top sample is either infeasible over-selection or collapses. (ii) Even a perfect quantum annealer cannot reach the optimum on this QUBO. The exact ground state of the pure-site QUBO is 42.141 — 1.7 below the true optimum — because the overlap-penalty surrogate under-counts triple coverage; that is a formulation ceiling, not a solver failure, and the exact formulation that avoids it is unsimulable. (iii) There is a hard wall on “simulate everything.” A statevector is 2n amplitudes, so gate-model QAOA caps near 24–28 qubits; the operational 26-site instance (with auxiliaries, ~150 variables) can never be gate-simulated — only the annealer proxy, or real hardware, reaches it, and finding (ii) still applies there. Net: at PHOENIX's operational scale, classical is optimal in milliseconds and quantum buys latency, not quality.
The formulation, precisely (so the benchmark is fair). Max-coverage is encoded exactly for CP-SAT (site-selection + covered-cell variables, cardinality budget). For the annealer/QPU it becomes a penalty-QUBO with auxiliary coverage + slack bits (the form a real D-Wave Advantage2 consumes). For the statevector simulator it is reduced to a pure-site QUBO — one qubit per eligible site, overlap-penalty surrogate — so it fits in 14 qubits. Every backend's chosen sites are then re-scored by the same true risk-coverage objective, so the surrogate's approximation error (finding ii) and QAOA's gap (finding i) are both visible, not hidden. This is the swappable-backend, same-instance, same-scorer discipline the QPU-blocked rule requires.
Reproducibility — data and method (do this yourself).
Instance: candidate sites on high ground around Alessandria della Rocca (37.5736 N, 13.4533 E) with a synthetic terrain/LoRa-reachability/road-cost model; a risk grid from a WUI × fuel × ignition proxy (normalised to total risk = 100). Coverage = detection range × a coarse DEM line-of-sight. Provenance: synthetic-illustrative until Gaetano's real surveyed sites + an EFFIS/fuel/ignition risk layer replace it — the solver comparison is instance-independent.
Backends: CP-SAT (OR-Tools) exact; greedy (1−1/e); simulated annealing on the true objective; D-Wave Ocean SimulatedAnnealingSampler on the penalty-QUBO (annealer proxy); ballistic Simulated Bifurcation; QAOA on the Qiskit statevector simulator (COBYLA angle optimisation, depths 1–3, 3 restarts) and a second QAOA in PennyLane; dimod.ExactSolver ground state.
Scoring: every backend's site set re-scored by the identical risk-weighted union-coverage objective; the reduced instance additionally enumerated in full (all feasible subsets up to the budget) for the true global optimum and the option landscape (median 27.3, p90 36.3, unique optimum).
Compute: CPU only, load-guarded, seconds; no production path touched. Real-QPU (D-Wave Advantage2 / Leap hybrid) and a learned risk layer are staged for cloud, never the laptop.
Claim status: NEGATIVE for quantum advantage (exhaustively verified — no quantum/quantum-inspired backend beats the classical optimum on the same instance by the same objective) + SUPPORTED for the classical CP-SAT placement optimiser as the deployable tool. The specific site coordinates are EXPLORATORY (synthetic geometry) pending real Sicilian layers; the solver comparison is instance-independent.
Current literature & PHOENIX alignment. Verdict: AGREES with the quantum-optimisation benchmarking literature. Quantum algorithms for Earth-observation planning and wildfire-relevant optimisation are an active, legitimate research line — satellite mission planning [27], remote-sensing data-processing reviews [25], and network-separation / fuelbreak strategy [26] — but none demonstrate advantage over strong classical solvers at operational instance sizes, which is exactly our result. Maximum-coverage is NP-hard in general yet solved to proven optimality by CP-SAT [28] at our scale, with the greedy (1−1/e) guarantee as a floor.
What the external literature reinforces: that quantum optimisation for EO/wildfire is worth benchmarking and formulating cleanly [25][27], and that a principled optimiser (with a fuel/exposure/terrain risk objective, cf. [13][14][29]) is the right instrument for siting — the value is the objective and the solver, not the backend.
Where PHOENIX is stricter or diverges: we do not merely assert “no advantage” — we enumerate every feasible option to know the unique optimum, then decompose the quantum “match” into raw-QAOA (P(optimum)≈0) plus a classical repair, and report the QUBO formulation loss (1.7) that even a perfect solver cannot escape. Quantum must beat the strongest classical baseline on the same instance by the same true objective, or it is not adopted.
What this post does not claim: it does not claim quantum is useless in principle — denser satellite-tasking / responder-routing problems, real hardware, or future scaling may change the balance — only that at PHOENIX's siting scale, classical CP-SAT is optimal in milliseconds and quantum adds latency, not quality. It does not claim the illustrative site coordinates are operational; the risk layer and candidate sites are synthetic pending real data.
Next research test: run the identical penalty-QUBO on a real D-Wave Advantage2 (Leap) and an IBM Heron QPU to close the hardware loop on the same instance; replace the synthetic geometry with Gaetano's surveyed candidate sites + an EFFIS/fuel/ignition risk layer over the Alessandria della Rocca AOI (and the top-recurrence cells from [0091], e.g. Cianciana); add explicit LoRa-mesh connectivity, road-access and power constraints; then scale to the full Sicily AOI where CP-SAT time-to-proof, not solution quality, becomes the metric to watch.
Public data sources:Google OR-Tools CP-SAT (classical baseline) · D-Wave Ocean SDK (annealer proxy + real-QPU path) · Qiskit + Aer and PennyLane (gate-model QAOA simulation) · future real risk layer from EFFIS fire danger / fuel and NASA FIRMS recurrence (siting prior). Every number reproduces from the linked scripts with no access to PHOENIX infrastructure.
Method note: the quantum “match” is reported decomposed — raw QAOA P(optimum bitstring) alongside the post-repair score — and the surrogate QUBO's 1.7-point loss is stated, not hidden; the reduced instance's global optimum is a full enumeration, not a solver claim.
entry 0093
The whole quantum column, screened honestly: nine methods, stacked, none beat a fair classical baseline — the one that looked perfect was a mirage, and the only quantum idea that pays off is signing the alerts
Date: 2026-07-01 Status: NEGATIVE, comprehensive — nine quantum / quantum-inspired methods + a stacked hybrid screened against MANDATORY classical baselines on a SEVIRI-calibrated fire/non-fire task; 0/9 beat a fair baseline; the single apparent win (a perfect 1.000) was refuted as a baseline-tuning mirage; stacking gave negative emergent lift. + one SUPPORTED deployable non-detection win: post-quantum signed alerts (ML-DSA-65). Feasibility screens on realistic synthetic data (sim-first, per [0091]); survivors escalate to the real corpus. Prompted by a direct challenge: is there ANY untested quantum value, single or stacked?
The analogy. We had only kicked the tyres on one quantum idea — optimisation ([0093]) — and were fairly challenged: what about all the others on the list? Kernels, tensor networks, clustering, quantum image tricks, deblurring, particle filters — and combining them? So we built a test bench and ran the whole list on the same “is this pixel a fire?” data, each pitted against the best ordinary method, with a shuffled-label sanity check every time. Every quantum method tied or lost. One briefly looked perfect — and a perfect score is the tell-tale of a mistake, not a miracle; a properly-tuned ordinary method matched it exactly, so we binned it. Stacking several quantum methods together made things worse, not better. The one place a quantum idea genuinely earns its keep isn't detection at all: signing our fire alerts with post-quantum cryptography so nobody can forge or tamper with them.
BLUF. Answering the challenge directly — is there any untested quantum value, single or stacked? — we screened the full simulable quantum column against fair classical baselines on a fire/non-fire task calibrated to entry [0088] (derived features ≈ chance 0.53; full 11-band spectrum ≈ 0.64; placebo ≈ 0.50). Result: 0 of 9 methods beat a fair classical baseline, and stacking them produced NEGATIVE emergent lift (best stack 0.478 < best single 0.564). The lone apparent win — a quantum one-class anomaly kernel at AUC 1.000 vs a default classical 0.777 — was a mirage: a gamma-tuned classical one-class SVM also reaches 1.000, so the “advantage” was an under-tuned baseline on cleanly-separable synthetic data, refuted before it could mislead. This is the exhaustive version of the challenge, and it lands where [0091] and [0093] did: at PHOENIX scale quantum is a benchmark, not a detection capability. The exception, and it is a real one: post-quantum signed alerts — ML-DSA-65 (NIST FIPS 204 [33]) — give every PHOENIX event a forgery- and tamper-proof signature that survives a future quantum adversary. Built and self-tested: it verifies a clean alert, rejects a 0.78→0.99 tampered confidence, and rejects a wrong-key signature.
Results — the full column (quantum vs FAIR classical baseline, same data, same metric).
The mirage, named (this is the method). The quantum one-class kernel scored a flawless 1.000 against a default RBF one-class SVM at 0.777 — and flagged as the sweep's only “advantage.” A perfect score on real-shaped data is almost always self-deception, so we tried to kill it before believing it. The kill was immediate: sweeping the classical one-class SVM's gamma reaches AUC 1.000 too, and a k-NN-distance detector hits 0.88. The fire signal in this feasibility set is a clean multi-band shift, so any adequately-tuned detector separates it; the quantum kernel's fidelity-collapse for distant points did the same thing, no better. The apparent edge was entirely an under-tuned baseline, not quantum skill. Reporting it as an advantage would have been the exact results-chasing error this log exists to avoid.
Why stacking made it worse, not better. The direct ask was whether combining methods creates value a single one cannot. We built out-of-fold predictions from a classical GBM, the quantum kernel SVC, and a tensor-network-compressed GBM, and trained a logistic meta-learner on them (stacked generalisation, leakage-controlled). The stack scored below the best single base (0.478 vs 0.564): the quantum and tensor-network bases are weaker and correlated with the classical one, so a meta-learner mostly imports their noise. No emergent capability appeared from any pairing or the full ensemble.
The one that pays off — post-quantum signed alerts (orthogonal to detection). The genuinely useful quantum-adjacent item is not a detector. Every PHOENIX alert is now signable with ML-DSA-65 (FIPS 204 [33]; ML-KEM-768 / FIPS 203 [34] is wired for feed transport): a 3,309-byte lattice signature over the canonical event JSON, with a QRNG-or-CSPRNG event nonce and a public-key fingerprint. Self-test: a clean alert verifies; a tampered confidence (0.78→0.99) is rejected on payload-hash mismatch; a wrong-key signature is rejected on fingerprint mismatch. This lets citizens, Gaetano's ground nodes, and the public API trust that an alert is really from PHOENIX and unaltered — a guarantee that holds even against a future quantum adversary (“harvest now, verify later”). Keys live in the secrets store, never in source or on this site.
Reproducibility — data and method (do this yourself).
Task: 11-band SEVIRI-like fire vs intensity-matched non-fire, calibrated so derived features (temperature, MIR−TIR) ≈ chance and only the full spectrum carries a modest signal (matching [0088]'s real 0.51 / 0.64). Provenance: synthetic feasibility screen (sim-first, per [0091]) — any method that beat classical here would escalate to the REAL spec12 corpus on RunPod before any claim; none did.
Discipline: every quantum method vs a mandatory, fairly-tuned classical baseline on the same data by the same metric; a shuffled-label placebo (≈0.50) on every learned screen; nothing promoted; a perfect score treated as a bug until refuted (and it was).
Backends: Qiskit + Aer and PennyLane (quantum kernels, FRQI, QFT, QAOA statevector), D-Wave Ocean (QUBO clustering), NumPy (TT-SVD tensor networks, quantum-inspired particle filter). PQC via pqcrypto/liboqs (ML-DSA-65, ML-KEM-768). CPU only, load-light; no QPU, no DGX.
Claim status: NEGATIVE (comprehensive) — 0/9 quantum methods and the stacked hybrid beat a fair classical baseline; the lone apparent advantage refuted as an under-tuned-baseline mirage. + SUPPORTED for post-quantum signed alerts as a deployable, non-detection integrity control. Feasibility is on synthetic data (EXPLORATORY provenance); the negative is robust because the comparison is head-to-head on identical data.
Current literature & PHOENIX alignment. Verdict: AGREES with the quantum-ML / quantum-optimisation state of the art. Quantum kernels, annealing and QML for Earth observation are legitimate research lines ([25][27][26]) but do not demonstrate advantage over strong classical methods at operational data scales — which is exactly our column-wide result. On cryptography we AGREE with and adopt the NIST post-quantum standards (ML-DSA / FIPS 204 [33], ML-KEM / FIPS 203 [34]).
What the external literature reinforces: that quantum methods for remote sensing are worth benchmarking honestly rather than adopting on reputation ([25]), and that post-quantum signatures are the correct, standardised way to future-proof message integrity ([33]).
Where PHOENIX is stricter or diverges: we ran the entire simulable column (not a cherry-picked method), tuned the classical baselines fairly, attached a placebo to every learned screen, and actively refuted our only positive result rather than publishing a 1.000. A results-chasing pipeline would have shipped the “quantum anomaly detector beats classical” headline.
What this post does not claim: it does not claim quantum is useless in principle — larger problems, real hardware, or future scaling may differ — only that across nine methods and their stacks, none beat a fair classical baseline on real-shaped PHOENIX detection tasks. It does not claim a real-corpus result (this is a synthetic feasibility screen), nor that PQC aids detection (it is an integrity control, not a detector).
Next research test: none of the nine earned escalation, so the detection sweep is closed pending new methods; the productive follow-through is to wire pqc_alerting.py into the live alert feed (sign every event; publish the public key; verify at the citizen app / ground-node / API boundary) and to re-open the sweep only if a specific method clears the fair-baseline bar on the real spec12 corpus.
Public data sources: the screens are self-contained (synthetic, calibrated to [0088]'s real SEVIRI result); real-corpus escalation would use EUMETSAT MSG-SEVIRI / MTG-FCI and NASA FIRMS truth. Tooling: Qiskit/Aer, PennyLane, D-Wave Ocean, NIST PQC (ML-DSA/ML-KEM via liboqs). Every number reproduces from the linked scripts with no access to PHOENIX infrastructure.
Method note: the sole positive was reported with its refutation (default-baseline 0.777 → tuned-baseline 1.000 = quantum 1.000); the stacking result is out-of-fold and leakage-controlled; the PQC claims are a runnable self-test (verify/tamper/wrong-key), not assertions.
entry 0094
A forest ranger's fire, below both geostationary floors — confirmed from the ground, missed from space, and the night sensor that could have caught it was disabled in our own pipeline
Date: 2026-07-01 Status: defensible — full multi-sensor miss-sweep + per-pixel reprocessing of both geostationary imagers (SEVIRI 3.9 µm and MTG-FCI 3.8 µm) at a ground-truth-confirmed point, with the live detector at default and relaxed thresholds; the 3×3 neighbourhood is checked to absorb geolocation/parallax; honestly bounded to one event and one night, with the single untested sensor (VIIRS Day-Night Band) named as a hypothesis, not a catch. Direct successor to the sub-hectare floor of [0091].
The analogy. The strongest witness we can have is a trained one standing in front of the fire. On 30 June a forest ranger — our Sicily ground collaborator — watched a fire burning and gave us its coordinates. We never flagged it. So we did what this log demands: assume we failed, and turn over every instrument until we either find the fire or prove nothing we own could have seen it. We checked the low-orbit fire satellites, the two continuous geostationary eyes, the smoke and news feeds — nothing. Then we re-ran the raw thermal imagery pixel-by-pixel at the ranger's exact spot, on both geostationary satellites, and the fire simply is not in the data: too small to warm even the finer 2 km pixel by more than a few degrees. It is a real fire, below the floor of the instruments — and, uncomfortably, the one sensor built to catch exactly this (a night camera that sees the glow of flames, not their heat) had been switched off by a bug in our own code. We fixed that, but it does not change this fire's verdict.
BLUF. A forest-ranger-confirmed active fire (Agrigento hinterland, ~37.460 N 13.226 E, a second coordinate ~400 m SSW; 21:20 local / 19:20 UTC, 30 Jun 2026), under a clear sky (ECMWF total cloud cover 0.06–0.20 by 18:00 UTC — not an occlusion excuse). The full sweep: NASA FIRMS NRT across VIIRS SNPP/NOAA-20/NOAA-21 + MODIS returned nothing within 20 km; MTG Active-Fire L2 and Sentinel-3 SLSTR, which both covered the 19:20 UTC window, correctly caught a real fire cluster near Etna ~150 km east and were empty at the ranger's point; internal detectors, MetImage, TROPOMI smoke, and the Italian news/fire-brigade feeds — nothing. The decisive test is per-pixel reprocessing, run this time on both imagers with the live subpixel_v1 detector at production and relaxed thresholds. SEVIRI (3.9 µm), 33 frames 19:00→04:40 UTC: 3×3 neighbourhood MIR max never exceeded 293.0 K, MIR−TIR delta was negative (−1.8 K, ordinary background bias, not fire), baseline anomaly peaked at 0.998σ — no firing, default or relaxed. MTG-FCI (3.8 µm), 29 frames: the finer pixel earned exactly the whisper physics predicts — neighbourhood max 297.1 K, delta flipped slightly positive (+1.7 to +2.2 K) — and still ~23 K short of the ~320 K a resolvable fire pushes into the band. No firing. Two independent geostationary thermal imagers, conclusively below floor, on a ground-truth-confirmed fire. This is [0091]'s sub-hectare floor, nailed to a witnessed point with two sensors agreeing.
The reprocessing, side by side (live detector, same point, same window).
| sensor / band | frames | 3×3 MIR max | MIR−TIR delta | baseline z | detector (default) | detector (relaxed) | verdict |
|---|---|---|---|---|---|---|---|
| SEVIRI 3.9 µm (~3 km) | 33 | 293.0 K | −1.8 K | 0.998σ | no | no | below floor |
| MTG-FCI 3.8 µm (~2 km) | 29 | 297.1 K | +2.2 K | — | no | no | below floor |
| — a detectable fire needs | — | ≥~320 K | strongly + | ≥3σ | — | — | — |
Why the neighbourhood check matters (closing the parallax loophole). We sampled the pixel nearest each coordinate and its 3×3 neighbourhood maximum, precisely so a signal nudged into an adjacent cell by geolocation error could not hide. A surface fire's geostationary parallax over these 500–800 m hills is under a kilometre (less than a pixel; cf. terrain parallax), so any real anomaly would appear in the 3×3 max — and there was none, in either imager. This forecloses a whole family of tempting fixes: there is no thermal contrast to recover, so you cannot super-resolve, deconvolve, threshold-relax or subpixel-retrieve it ([0091]), and the finer FCI band does not rescue it. It is a size effect: whatever the fire's true dimensions — and a ground observer gives us no area — it was small enough to raise a 2–3 km cell by at most a few kelvin.
A lightning footnote, stated precisely because it is easy to over-read. A MTG Lightning Imager flash cluster crossed the Agrigento hinterland around midday, nearest strikes ~8 km NW and ~6 h before the fire — a plausible ignition, a poor locator. The LI geolocates the cloud-top optical emission (8–15 km up), and from MTG at 0° longitude Sicily is viewed at a ~46° zenith angle, so the parallax displacement is ~1.0× the emission height: a flash's apparent position is 8–15 km NNE of the true ground strike — an order of magnitude worse than a surface fire's. A flash coordinate is a ~15 km blob, an ignition prior, never a locator, consistent with [0082].
The uncomfortable operational finding. The one instrument that could plausibly have seen this fire is not thermal at all: the VIIRS Day-Night Band images the visible glow of combustion at radiances far below the 375 m thermal floor [9], so it is not bound by the contrast wall above. Our DNB feed had ingested nothing for days, and the cause was ours: a per-scene candidate cap was applied before the persistent-light mask, so every summer-Sicily night scene — dense with town and coastal lights — tripped the cap and was discarded whole, before the code that removes those known lights ever ran. We reordered it (mask first, cap on what remains). Honesty requires the caveat that this does not touch this fire's verdict: relaxing a threshold or fixing an ingest cannot conjure a SEVIRI or FCI signal the reprocessing just proved absent. DNB's value is that it is a different sensor; its standard product for the fire night lags 12–48 h and had not posted when this was written, so whether DNB actually caught the glow is a hypothesis, not a result, to be reported plainly either way when the granule lands.
Reproducibility — data and method (do this yourself).
Task: at the ranger's coordinates, extract the fire-band brightness temperature across every archived geostationary frame of the burn night, run the production sub-pixel detector on each at default and relaxed thresholds, and compare against a per-pixel-hour-of-day diurnal baseline. Verdict is present-but-subthreshold vs absent.
Discipline: both imagers, not one; the 3×3 neighbourhood max, not just the centre pixel; default and relaxed thresholds; the untested DNB named as a hypothesis; the fire's size acknowledged as unmeasured.
Provenance: real EUMETSAT MSG-SEVIRI (3.9 µm IR_039) and MTG-FCI (3.8 µm IR_38) frames over Sicily; ground truth is a forest-ranger eyewitness report (no personal data published). Full re-run requires the EUMETSAT archive [8] and the PHOENIX detector; the exact per-frame series and verdicts are published below.
Claim status: defensible — two independent geostationary thermal imagers below floor at a ground-truth-confirmed fire under clear skies; the miss is a size effect, not a tuning failure. Bounded to one fire, one night, one location, an unmeasured fire size, and a DNB test still pending (named as a hypothesis).
Current literature & PHOENIX alignment. Verdict: AGREES with the spaceborne fire-detection state of the art. MTG-FCI's finer pixel and dedicated fire bands genuinely improve small-fire detection and FRP retrieval over MSG-SEVIRI [5] — which is exactly what we measured (FCI a few kelvin better than SEVIRI) — but neither reaches a sub-hectare fire at ~2–3 km resolution, consistent with the physics. The complementary strengths of the 375 m polar VIIRS product [9] and the known systematics of nighttime VIIRS detection [11] reinforce that small night fires are a LEO/DNB problem, not a geostationary-thermal one.
What the external literature reinforces: that geostationary fire detection is a delivery-speed advantage bounded by a coarse pixel [5], and that the detection of small and nighttime fires belongs to finer-resolution and different-physics sensors [9][11].
Where PHOENIX is stricter or diverges: we did not stop at one sensor — we reprocessed both geostationary imagers at the exact witnessed point, checked the neighbourhood to defeat parallax, ran default and relaxed thresholds, and reported our own ingest bug rather than quietly fixing it. A results-chasing pipeline would have leaned on “clear skies, should have caught it” instead of proving the signal is physically absent.
What this post does not claim: it does not claim the fire was undetectable by any instrument — VIIRS DNB (night glow) and next-day Sentinel-2 SWIR active-fire / dNBR burn scar are the untested remaining levers; it does not claim a DNB result (the granule had not posted); and it does not report the fire's size (a ground eyewitness gives none). It claims only that two geostationary thermal imagers were below floor here.
Next research test: pull the fire-night VIIRS DNB granule once it posts and run the corrected detector at the point; task next-day Sentinel-2 for an active-fire / burn-scar check; and treat the ranger's report as a primary detection in its own right ([0036]), fused into the wildfire state ([0090]) rather than discarded as a hint.
Public data sources:EUMETSAT MSG-SEVIRI + MTG-FCI (fire bands), NASA FIRMS (VIIRS/MODIS NRT truth), and MTG Active-Fire L2 + Lightning Imager. Every published number reproduces from the linked scripts against the EUMETSAT archive; no PHOENIX infrastructure access is required to re-derive the verdict from the published per-frame series.
Method note: the verdict is reported at both default and relaxed detector thresholds (neither fired); the “a detectable fire needs” row is the physical bar, not a fitted threshold; the DNB and Sentinel-2 lines are explicitly future tests, not present claims.
entry 0095
Quantum, deployed and stress-tested: post-quantum signed alerts go live, and the quantum-ML door gets its best shot — with a positive control that proves the test isn't blind
Date: 2026-07-01 Status: SUPPORTED (post-quantum signed alerts deployed as three isolated instances, wired into a live feed) + NEGATIVE, strengthened (best-shot quantum-ML kernels + a quantum-native positive control: the detection door stays closed on fire data, now with the control confirming the test can see an advantage when one exists). Continues [0093]/[0094].
The analogy. Two threads. First, a quantum-era upgrade you can actually hold: every PHOENIX alert is now cryptographically signed so it cannot be forged or tampered with — using post-quantum cryptography a future quantum computer still cannot break. Second, we kept the promise to keep testing whether a quantum computer can help us see fires: we gave the strongest quantum methods their best shot, and added a deck deliberately stacked for quantum as a control, so we'd know our test isn't simply blind to any advantage. The upgrade shipped; the detection door stayed shut — and this time the control proves the shut door is real, not a failure of the test.
BLUF — part A (deployed). PHOENIX alerts are now signable with ML-DSA-65 (NIST FIPS 204 [33]; ML-KEM-768 / FIPS 203 [34] for transport). It ships as three isolated instances — PHOENIX, INGV, OLDGABE — each with its own key and data plane, proven isolated: the cross-verification matrix is diagonal, so a PHOENIX-signed alert verifies only under the PHOENIX key and is rejected by the others (fingerprints PHOENIX 679290db, INGV b21e60b0, OLDGABE 7ec14b2b). It is wired into a live feed fail-open (signing never blocks an alert), and self-tests confirm it verifies a clean alert, rejects a tampered field, and rejects a wrong-key signature. This is a genuine quantum-era enhancement to PHOENIX — orthogonal to detection, and the one quantum-adjacent item that pays off today.
BLUF — part B (continuing research). We reopened the quantum-ML question with its best shot: IQP (Havlicek) fidelity kernels, projected quantum kernels (Huang et al.), and a trainable kernel (target-alignment), on the calibrated fire task — plus a quantum-native control whose labels are generated from the quantum embedding. Control passes: on quantum-structured data the matching fidelity kernel scores AUC 0.792 vs classical 0.675 — the test can and does detect a quantum advantage when the data suits it. Fire task: no advantage. The best quantum kernel (0.598) stays within n=80 noise of, and below, the fair full-11-band classical baseline (0.658 on the matched seed, ~0.64 at scale, cf. [0094]). Giving quantum its best shot did not open the door.
The trap we refused (watch the baseline). The raw run first flagged a fire-task “quantum win” — fidelity kernel 0.598 vs classical 0.55. That 0.55 classical was handicapped: to fit a 4-qubit circuit the features were compressed to 4 PCA dimensions, and the classical baseline was restricted to those same 4 dims. The honest comparison keeps the classical model on the full 11 bands (0.658 same-seed), where it beats the quantum kernel; the apparent edge was a baseline artifact plus n=80 noise, not quantum skill — the same discipline that killed the anomaly mirage in [0094]. A number is only as good as the baseline it beats.
What this establishes. With a positive control in hand, the negative is now precise rather than assumed: quantum ML helps only when the data carries quantum-native structure (the control), and fire-detection spectra do not (the fire task). That is a stronger, more defensible closure of the quantum-ML-for-detection question than the off-the-shelf sweep alone ([0094]), and it sits beside the deployed PQC win: we are actively researching quantum, we have shipped a real quantum-era enhancement, and we keep testing the detection question honestly.
Reproducibility — data and method (do this yourself).
PQC: ML-DSA-65 via pqcrypto/liboqs; three product instances, each keyed separately (secret keys in the secrets store only, never here); isolation + tamper + wrong-key self-tests. Public-key fingerprints above; public keys are distributable for open verification.
Quantum-ML door: IQP fidelity / projected / trainable quantum kernels (Qiskit + PennyLane, 4 qubits), fairly-tuned classical baselines (full 11-band RBF-SVM gamma sweep + GBM), a shuffled-label placebo, and a quantum-native control dataset. Feasibility scale (n=80, sim-first, per [0091]); a surviving method would escalate to the real corpus — none did.
Claim status: SUPPORTED for the deployed PQC signed-alert enhancement (three isolated instances, live-wired, self-tested) + NEGATIVE (strengthened) for quantum-ML detection advantage: best-shot kernels do not beat a fair classical baseline on fire data, and a quantum-native positive control confirms the test's power. No detection method promoted.
Current literature & PHOENIX alignment. Verdict: AGREES with the quantum-ML and post-quantum-crypto state of the art. Quantum kernels show advantage chiefly on data with quantum-native structure, not generic classical features — exactly our control-vs-fire split; quantum methods for EO remain worth benchmarking, not adopting on reputation ([25][27][26]). On cryptography we adopt the NIST standards directly (ML-DSA / FIPS 204 [33], ML-KEM / FIPS 203 [34]).
What the external literature reinforces: that a demonstrable quantum-ML advantage needs quantum-structured data (our control is the textbook case), and that post-quantum signatures are the standardised way to future-proof alert integrity ([33]).
Where PHOENIX is stricter or diverges: we gave quantum its best shot (projected + trainable kernels, not just off-the-shelf), attached a positive control to prove the test can see an advantage, and refused a fire-task “win” that only existed against a dimension-handicapped classical baseline. And we deployed the PQC enhancement as strictly isolated per-product instances rather than a shared service.
What this post does not claim: not that quantum ML is useless in principle (the control shows it works where structure exists), only that fire-detection spectra lack that structure at our scale; not a real-corpus detection result (feasibility scale); and PQC is an integrity control, not a detector.
Next research test: wire the PQC signer across every product's live emitter and publish each public key at the verifier boundary; and re-open the quantum-ML door only if a specific method clears the fair full-band baseline on the real spec12 corpus. The genuinely open non-computing avenue — quantum sensing (e.g. Etna quantum gravimetry) — is an instrument/access question, tracked separately.
Public data sources: tooling is Qiskit/Aer, PennyLane, NIST PQC (ML-DSA/ML-KEM via liboqs); the door screens are self-contained (calibrated to [0088]'s real SEVIRI result); real-corpus escalation would use EUMETSAT and NASA FIRMS. Every number reproduces from the linked scripts.
Method note: the fire-task “win” is reported with its refutation (0.598 vs 4-dim-handicapped 0.55, vs fair full-band 0.658); the control result is the positive check that the pipeline can detect a real quantum advantage; PQC claims are runnable self-tests (verify / tamper / wrong-key / cross-product isolation).
entry 0096
From “signed” to verifiable: the post-quantum keys are published, the live feeds check out, and anyone can now prove a PHOENIX alert is genuine
Date: 2026-07-01 Status: SUPPORTED (post-quantum signing now live on the actual running services across all three isolated products, public keys published at each product boundary, and independent consumer-side verification demonstrated end-to-end). Completes the deployment begun in [0096].
The analogy. A wax seal on a letter is only worth something if the recipient has a copy of the signet to check it against. Entry [0096] put the seal on PHOENIX alerts — a post-quantum signature a future quantum computer still can't forge. This entry hands out the signet: we published each product's public key at its own front door, wired the signing into the services that actually run (not just the code), and proved a stranger holding only that public key can confirm a live alert is authentic and untampered. A signature nobody can check is theatre; this is the part that makes it real.
BLUF. Three things went from “built” to operational and checkable: (1) signing is now wired into the running emitters of all three isolated products — PHOENIX (the DGX→edge detection push), the Etna/INGV feed, and the US system's API; (2) each product's public key is published at its own domain (PHOENIX at /.well-known/pqc-public-key.json), one key per file, never cross-linked, never a secret; (3) a consumer holding only the published key verified a live signed feed end-to-end (body hash matches, ML-DSA-65 signature valid). The integrity guarantee is now actionable by anyone, not just an internal assertion.
What changed since 0096, honestly. Entry 0096 reported the signer built and the PHOENIX push wired. Finishing the job surfaced two real gaps we then closed: the INGV signing had been added to a local mirror of the code, not the script the Etna detector actually runs on the box — so it was wired in source but not in production until we moved it to the live emitter and confirmed the signing path; and the US system went from “signer built, not attached” to signing every API response via a fail-open header hook. Both are now live on the running services. This is the difference between code that could sign and services that do.
How verification works (so you can do it). PHOENIX signs with ML-DSA-65 (NIST FIPS 204 [33]). The detection push carries an additive _integrity block (algorithm, product tag, signature, public-key fingerprint, and a SHA-256 over the canonical-JSON message); the payload rows are left byte-identical, so the signature is orthogonal to the data. A verifier fetches the published public key, recomputes the canonical message, checks the hash, and verifies the signature — a wrong key, a wrong product, or a single flipped field all fail. We exercised exactly this loop against a live feed and it passed. Fail-open remains the rule end to end: a missing key or library yields an unsigned alert, never a blocked one.
Isolation, restated because it matters. There is no shared signing service and no combined key file. Each product runs the same neutral library as a separate instance with its own key and its own data plane; each publishes only its own key at its own domain. A PHOENIX-signed alert verifies only under the PHOENIX key (fingerprint 679290db) and is rejected by the others — the diagonal cross-verification we proved in [0096], now with the public halves distributed for open checking.
Reproducibility. Public key: /.well-known/pqc-public-key.json (base64 key + fingerprint + scheme; public, non-forging). Signer library: pqc_sign.py. Verify recipe: fetch the key, recompute the canonical-JSON message over the payload minus _integrity, confirm the SHA-256, then ML-DSA-65-verify the signature with pqcrypto/liboqs. Secret keys live only in the secrets store and were never published or logged. CPU-only, no QPU; DGX changes rode the existing load-guarded, PHOENIX-health-gated emitter with no service restart.
Claim status: SUPPORTED. Signing is live on the running emitters of all three isolated products; each public key is published at its own boundary; a consumer using only the published key verified a live signed feed (hash + ML-DSA-65 signature). No new detection capability is claimed — this is an integrity/authenticity control.
Current literature & PHOENIX alignment. Verdict: AGREES with NIST PQC guidance. Publishing the verification (public) key while withholding the signing (secret) key is the standard asymmetric-signature deployment; ML-DSA (FIPS 204 [33]) and ML-KEM (FIPS 203 [34]) are the ratified primitives. Distributing public keys creates no forgery risk — forgery requires the secret key.
Where PHOENIX is stricter or diverges: we publish one key per product per domain (never a combined file that cross-links products), sign additively so the data bytes are untouched, keep signing fail-open so it can never block an alert, and we required an end-to-end consumer verification against a live feed before calling it done — not merely a unit test of the signer.
What this post does not claim: not confidentiality (signing proves authenticity/integrity, not secrecy); not that every historical alert is retroactively signed (only feeds emitted after wiring); and not a detection result of any kind.
Next research test: add a verifier widget at the consumer boundary (citizen app / public API) that checks the signature and surfaces a “verified genuine” state; monitor for the first organically-signed detection once one clears the sensitivity floor; and publish a signed, dated key-rotation policy.
Public data sources:NIST PQC (ML-DSA / ML-KEM, via liboqs); the published key and signer are self-contained and verifiable with no PHOENIX infrastructure access.
Method note: the end-to-end check fetches the published public key over the network and verifies a live response, so it exercises the same path an external consumer would; a wrong key / wrong product / tampered field each fail closed, while signing itself fails open.
entry 0097
The fire the satellites couldn't see, the fusion could — and letting weak clues drift downwind the way smoke does is what tipped it over
Date: 2026-07-02 Status: SUPPORTED (preliminary) — a multi-seed offline replay on event-level evidence, not yet an operational pixel-level detector. Builds directly on [0095].
The analogy. One faint witness who “maybe saw something” won't convince a jury. But if you take several faint witnesses — a barely-there glow at night, a recurrence of past fires nearby, a whisper of corroboration, and one person on the ground who phoned it in — and you let each clue drift downwind exactly the way smoke drifts, the clues pile up in the same place instead of scattering. Where they pile up, you have a fire. Entry [0095] proved a real, ranger-confirmed clear-sky fire sat below the floor of both geostationary thermal eyes — radiometrically invisible, nothing to sharpen. This entry asks the only question left: can combining the non-thermal whispers cross a rigorous false-alarm line and catch it anyway? On this replay, yes — and the single most important whisper was the citizen's.
BLUF. We built a small graph over the event-level evidence available the night of the fire — night-light (VIIRS DNB), the ground report, a recurrence-of-past-fire prior, cross-source corroboration, and the 10'm wind field — and wrapped the model's score in a conformal false-negative bound (a distribution-free guarantee, CRC-SGAD-style [37]) so “caught” means “cleared a stated error rate,” not “scored high.” Across 7 random seeds, a baseline attention graph caught the fire on 57% of seeds; a novel Advection-Diffusion Graph Neural Operator — whose message-passing kernel is a learnable discretization of the advection-diffusion PDE, so weak evidence physically transports along the wind ([35], [36]) — caught it on 86%, at matched alert footprint. Ablations are the story: remove the citizen report and the attention model falls to zero (the physics model to 43%); remove the wind and only the physics model degrades (0.86→0.71) while the attention model is unmoved — i.e. the physics operator actually uses the wind that attention treated as inert.
Results (7 seeds, conformal α=0.05, matched footprint ≈0.68–0.70, 837 real positive events). Caught-rate = fraction of seeds whose conformal-calibrated score cleared the false-negative bound at the truth node. ADGNO full 0.857 > ADGNO−wind 0.714 > attention full / −wind 0.571 > ADGNO−citizen 0.429 >> attention−citizen 0.000. Three readings: (1) non-thermal multi-modal fusion can cross a rigorous bound and recover a fire every operational feed missed; (2) the physics-informed operator beats the attention baseline and is the only model that productively exploits wind; (3) the ground report is the decisive single ingredient — consistent with [0095]'s finding that this fire class lives below the instruments and above the crowd.
Reproducibility. Model + training harness: fusion_gnn_adgno.py (the advection-diffusion operator, with a standalone physics self-test), fusion_gnn_conformal_train.py (graph build, baseline-vs-novel selector, from-scratch conformal FNR calibration, 7-seed driver). Full result cards: fusion_gnn_conformal_results.json. Compute was a single commodity GPU for a few minutes; the graph is event-level, so it trains on a laptop-class budget. No thermal channel is used as a positive signal for this event (it has none).
Claim status: SUPPORTED, preliminary. An offline, multi-seed replay on event-level evidence (records, not pixel frames — the geostationary frames for the fire night had rolled off cache; the probe in [0095] already established they carried no fire signal). It demonstrates that fusion + a conformal bound can catch this fire; it is not yet a deployed detector.
Current literature & PHOENIX alignment. Verdict: AGREES. Physics-informed and directed-edge graphs for wildfire are an active, published direction ([35], [36]); conformal risk control gives the distribution-free false-alarm guarantee we wrap around the GNN ([37]); spatial-shift-robust calibration (NexCP [38]) is the standard fix for a regional deployment. What the literature does not yet cover — and where this sits — is fusing a citizen ground report as a graph node alongside satellite evidence for active-fire detection; we found no prior work doing so.
What the literature reinforces: that architecture buys efficiency, not safety — the conformal layer supplies the guarantee regardless of model. Our footprint (≈0.68) is the efficiency cost, and it is high; the fair comparison is caught-rate at matched footprint.
Where PHOENIX is stricter or diverges: we pre-registered the ablations, required a distribution-free FNR bound rather than a raw threshold, judged models by multi-seed caught-rate (not a single lucky run), and report the honest failure mode — without the citizen node the attention model detects nothing.
What this post does not claim: not a pixel-level detector; not an operational result; not that thermal was recoverable (it was not — see [0095]); not a low false-alarm rate (the footprint is large and is the next thing to tighten); and one event is one event.
Next research test: tighten the footprint with harder negative mining and spatial (Mondrian / NexCP [38]) calibration; pretrain the operator on the Mediterranean Mesogeos datacube [39] and transfer to Sicily; add real-time-stamped temporal steps to the advection-diffusion integration; and, if the geostationary frames are backfilled, extend from event nodes to a pixel field.
Public data sources: VIIRS DNB night-lights and FIRMS active-fire (NASA), ECMWF 10'm winds, and an anonymized ground report (no personal data); the published code and result cards reproduce the analysis with no PHOENIX infrastructure access.
Method note: conformal calibration uses only held-out positive events (no leakage into the threshold); the advection weight per edge is the wind vector projected onto the edge direction, clipped to the downwind half-plane, so the operator can only transport evidence the way wind actually blows.
entry 0098
The detector was blind to dryness — giving it the fire-weather regime is what makes it survive a map full of look-alikes
Date: 2026-07-03 Status: SUPPORTED (preliminary) — a multi-seed offline replay; the improvement is in the robustness regime, not the single-operating-point number. Builds directly on [0098]. Correction (2026-07-03): the “VPD/dryness is the mechanism” attribution in this entry is superseded by the per-feature ablation in [0100] — the win is the fire-weather regime block as a whole (that stands), but it is distributed/redundant across features and the strongest single contributor is cloud cover, not VPD. The block-level result below is unchanged; only the single-variable mechanism claim is corrected. Magnitude correction (2026-07-04): the reproducibility audit in [0103] further finds the caught-rate magnitudes here (e.g. baseline→weather 0.43→1.0) were single-run and inflated by GPU nondeterminism; the repeated estimate of the lift is ~+0.17. The direction (weather helps under dilution) holds; the size is smaller and noisier than reported.
Why this entry exists. Entry [0098] showed fusion + a conformal bound could recover the clear-sky fire, and left an honest to-do: tighten the alert footprint and make it robust. The first instinct — add clean background non-fire nodes, or switch to a fancier spatial calibration — we tested and it was a trade-off, not a free win (backgrounds bought footprint by paying catch; per-region “Mondrian” calibration consistently hurt). Rather than stop at “it's hard,” we asked the sharper question: what was the model never allowed to see? The answer was the weather it was standing in.
BLUF. The fusion model used the wind vector but was blind to the fire-weather regime — above all the vapour-pressure deficit (VPD), the single most important dryness/fire-danger variable, plus temperature, boundary-layer height, cloud and wind speed. We added those five per-node features and stress-tested detection under a realistic map-scale dilution: flood the scored area with a large population of non-fire look-alikes, the way a real deployment scores a whole landscape that is mostly not burning. Plain global calibration collapses in that regime (catch 0.14–0.43). Adding the fire-weather regime restores it: catch 0.87 at 15 seeds, 1.0 at 7 seeds, paired with spatial-shift-robust NexCP calibration [38]. The ablation is unambiguous — regime is the whole win.
Results (adgno, dilution regime, NexCP calibration; caught-rate = fraction of seeds recovering the truth at a stated false-negative bound). Baseline 0.429 → + fire-weather regime 1.0 (7 seeds; 0.867 at 15 seeds), footprint ~0.52. Attribution ablation, each lever alone: weather 1.0, hard-negative weighting 0.571, contrastive-margin 0.286, and the loss levers added to weather drag it back down (1.0→0.71) rather than helping; extra model capacity inflates the alert footprint to 0.999 (useless). The physics operator is required: the same regime features on the attention baseline stay at 0.14. At the easy canonical operating point (no dilution) catch is already saturated, so the regime helps precisely where it is supposed to — under dilution.
Why it works (physically). A clear-sky, dry-summer Sicilian fire lives in a high-VPD regime. Given dryness, the model can tell a genuinely dangerous dry location from a look-alike signal in a less-dry area, so the fire's score stays above the local (distance-weighted) threshold even when the map is flooded with non-fire nodes. Without dryness, the fire is just one weak signal among many and the threshold drowns it.
Claim status: SUPPORTED, preliminary. A multi-seed offline replay on event-level evidence, consistent with [0098]. The gain is specifically in robustness under dilution; it does not lower the footprint at the un-diluted operating point (that graph is small and mostly fire-like — likely irreducible there), and it is one event.
Current literature & PHOENIX alignment. Verdict: AGREES. VPD is the established dominant fire-danger/behaviour driver in fire-weather science; distribution-shift-robust conformal calibration (NexCP [38]) is the standard fix when the scored population is not exchangeable with calibration — exactly our dilution setup. The combination — regime-conditioned evidence fusion wrapped in a shift-robust bound — is where this sits.
What we tested and rejected (honest negatives): background-negative injection is a footprint/catch trade-off dial, not a free win; per-region “Mondrian” calibration consistently hurt catch; contrastive-margin, hard-negative weighting and focal loss did not improve on the regime features and often hurt; added capacity inflated the footprint. We report these because they are as informative as the win.
What this post does not claim: not a pixel-level or deployed detector; not a footprint reduction at the canonical point; not that regime helps where detection is already saturated; and one event is one event.
Next research test: carry the regime-conditioning result out of the replay and into the operational camera network — a regime-gated detection threshold that is sensitive on dry high-danger days and conservative on humid/foggy ones, evaluated on false-alarms-per-camera-per-day at fixed time-to-detection; and a satellite-supervised auto-labelling loop so the Sicily detector accretes its own training data.
entry 0099
We said dryness; the data says clear-sky — a per-feature ablation corrects the mechanism behind the fire-weather win
Date: 2026-07-03 Status: SUPPORTED (attribution study) — and it corrects the single-variable mechanism claim in [0099]. Builds on [0098], [0099]. Magnitude correction (2026-07-04): the caught-rate numbers here (baseline 0.2 → all-five 0.9) were single-run at 10 seeds; the reproducibility audit in [0103] re-estimates the weather lift as roughly a quarter of that (0.55→0.72) and shows single-run rates carry ±0.1 GPU noise. The direction (regime block helps) stands; the magnitude and the exact feature ranking do not.
Why this entry exists. Entry [0099] reported that adding the fire-weather regime made detection robust under map-scale dilution, and claimed the mechanism was vapour-pressure deficit (VPD / dryness). That was a mechanistic claim tested only at the level of the whole five-feature block. Proper practice — and our stated standard — is to test the specific claim. So we ran a per-feature ablation: each regime feature alone, and each one left out. The block-level win survives; the VPD attribution does not.
BLUF. The fire-weather block as a whole is genuinely the lever (baseline caught 0.2 → all-five 0.9, adgno / bg800 dilution / NexCP / 10 seeds). But the effect is distributed and redundant: every single feature beats baseline, and no single feature is necessary — every leave-one-out stays ≥0.7. The strongest single contributor is cloud cover (tcc), not VPD: cloud cover alone reaches 1.0 and its removal causes the largest drop (0.9→0.7), whereas VPD alone is mid-pack (0.8) and removing it barely moves the result (0.9→0.8). So Entry 0099's “dryness is the mechanism” is corrected: it is the regime block, led by the clear-sky signal, not VPD specifically.
Why clear-sky, physically. The fire in [0095] was a clear-sky event — that is the entire reason the geostationary thermal eyes missed it. Cloud cover (tcc) is precisely the marker of that regime: when the model knows the sky is clear, it can trust the weak, sub-threshold non-thermal evidence instead of discounting it. For this class of fire the clear-sky context is a more direct discriminant than general dryness — which is why the data prefers tcc over VPD, and why our original intuition (VPD, the classic fire-danger variable) was reasonable but wrong for this specific detection problem.
Mechanism, examined (why cloud cover specifically). We inspected the actual feature values across node populations to check whether cloud cover is a real spatial discriminant or merely a near-constant that night. It discriminates: the fire sat at the clearest point (tcc 0.008), while the hard look-alike negatives sat under more cloud (FIRMS-caution 0.15, single-frame 0.10). Crucially, VPD separates the fire from empty background (driest, 2.19 vs 1.40 kPa) but barely from the look-alikes (FIRMS-caution 1.99 ≈ truth 2.19) — whereas cloud cover separates the fire from precisely those look-alikes. Since the binding problem under dilution is telling the fire apart from confusers, not from empty background, the feature that separates it from confusers (cloud cover) beats the one that does not (dryness). That is the concrete reason the ablation ranks tcc above VPD. Data caveat: boundary-layer height (blh) is all-NaN in this replay export — a dead feature — so its ablation value (≈baseline) is uninformative; the live pipeline should populate or drop it.
Claim status: SUPPORTED (attribution). Robust conclusions: (1) the regime block >> baseline (0.2→0.9); (2) no single feature is necessary (all leave-one-outs ≥0.7); (3) the strongest single feature is cloud cover, and VPD is not uniquely responsible. Caveat, stated plainly: 10 seeds give caught-rate in 1/10 steps, so the ordering of mid-pack features (t2m/blh/wspd) carries ~±0.1 noise and should not be over-read; the three numbered conclusions are what the data supports, not the exact ranking.
What this corrects and what it leaves standing: it corrects only the single-variable mechanism attributed in [0099] (VPD → regime-block-led-by-cloud-cover). The 0099 block-level result — regime features restore robustness under dilution, and the physics operator is required — is unchanged and independently reproduced here (all-five 0.9 vs baseline 0.2).
What this does not claim: not that VPD is useless (it beats baseline alone); not that cloud cover is a sole cause (the effect is redundant); not a deployed detector; and it is still one event.
Reproducibility & why we publish a correction: the ablation is a single flag over the published training harness (--weather_feats, per-feature and leave-one-out). We post the correction rather than quietly editing 0099 because a rigorously-measured refutation of our own claim is exactly as useful to the record — and to anyone building on it — as the original win; it saves the next person from inheriting the wrong mechanism.
Next research test: carry the corrected signal into the camera domain as a clear-sky-aware regime gate (cloud cover + dryness), and confirm the cloud-cover effect on a second, non-clear-sky event to see whether the strongest single feature shifts with the fire class.
entry 0100
The weather lever is gated: a second real fire shows cloud-cover conditioning does nothing when there is no weak signal to amplify
Date: 2026-07-03 Status: SUPPORTED (boundary condition) — a measured negative that bounds the applicability of the [0100] mechanism. Builds on [0095], [0098], [0099], [0100].
Why this entry exists. Entry [0100] closed by asking us to “confirm the cloud-cover effect on a second, non-clear-sky event to see whether the strongest single feature shifts with the fire class.” So we built one. We pulled a second, independent, ground-confirmed Sicilian fire from the ground-truth record — a Vigili del Fuoco-confirmed fire near Catania (37.502, 15.087) on 2026-06-26 — and ran the identical twelve-configuration weather ablation on it: same look-alike negative populations, same model, same NexCP calibration, same dilution regime; only the truth location and the ECMWF weather window changed. The intended contrast was real: the Catania fire sat under partial cloud (tcc 0.25, cloudier than its window mean of 0.159), the mirror image of the Gaetano fire that sat at the clearest point (tcc 0.008). We expected the strongest single feature to shift. It did not shift — because nothing was detected at all, and the reason is more fundamental than weather.
BLUF. On the Catania event the detector catches the held-out fire in 0 of 10 seeds — in every one of the twelve configurations, with weather, without weather, cloud-cover-only, all identical. This is not a failure of cloud-cover generalization; it is the absence of anything to generalize over. The Catania fire had no non-thermal weak signal at its location — no citizen report, no in-window corroboration, no active FIRMS-anchored prior. The truth node was an evidence island (fused score 0.0004), so it never approaches the conformal bound, and the weather block — which re-weights weak evidence — has nothing to act on. The finding: the fire-weather lever of [0099]/[0100] is gated on the presence of at least one weak non-thermal signal. With none, it is inert.
The diagnosis, at the node level. The Catania truth node's features are almost entirely zero: citizen-proximity 0, corroboration 0, FIRMS-prior below average, and every thermal channel (FRP, brightness temperature, persistence, sensor/pass counts) 0. The only non-trivial inputs are area recurrence (a base rate: fires happen here) and the weather features themselves. Contrast the Gaetano node, which carried a decisive citizen-report signal ([0098]) that the clear-sky regime then amplified. Weather amplified a signal there; here there is no signal, and 0.008-vs-0.25 cloud cover is beside the point.
Is the empty node faithful, or did we filter it out? We checked the ground-truth database directly rather than assume. All twenty citizen reports on record sit in the western Agrigento sector (longitude 13.2–14.0); zero fall anywhere near Catania. Corroboration signals that week: zero. Active priors at the location: negligible. So the evidence-empty node is a true property of this event, not an artifact of how we exported it — the Catania fire was found by the thermal sensors and the fire brigade, and simply never generated the crowd/corroboration trace that the fusion layer exists to exploit.
Claim status: SUPPORTED (boundary condition). What it establishes: a necessary precondition for the entire fusion-plus-conformal approach — it recovers a sub-threshold fire only where at least one weak non-thermal modality (citizen, corroboration, or active prior) is present; weather conditioning tunes that evidence but cannot create it. This unifies the arc: [0098] (the citizen signal is decisive), [0099]/[0100] (weather amplifies it), and here (no signal → weather inert).
Literature alignment: consistent with the first principle of evidence fusion — a fusion model cannot exceed the information in its most informative available modality, and a distribution-free conformal wrapper cannot lower an alert bound below what the evidence supports. Neither manufactures signal. Our result is the concrete Sicilian instance of that principle.
Operational reading (important, so this is not mis-read as a regression): Catania was not a miss operationally — the thermal sensors and Vigili del Fuoco caught it. The fusion layer is aimed specifically at the sub-threshold, clear-sky misses like [0095], where a weak human/corroboration signal is the only available handle. This entry sharpens where that layer adds value: precisely when such a handle exists.
What this does not claim: it does not test whether cloud-cover dominance shifts with fire class (that test needs a second event that has a weak signal — see below); it does not claim the method fails; it is one event on each side of the contrast; and it says nothing about thermally-detectable fires, which are handled upstream.
Reproducibility: the second-event replay was exported read-only from the ground-truth database under the same load-guarded pipeline as the first, ships as a 292 KB slim tarball, and runs through the identical published training harness — the only inputs that change are the truth coordinate and the ECMWF window. The 0/10-across-all-configs result and the 0.0004 node score are both reproducible from that artifact.
Next research test: we identified the right second event for the cloud-cover-generalization question the ground-truth record actually supports — a distinct, citizen-reported fire in the Agrigento sector on 9–11 June (sixteen smoke/flame reports near 37.57, 13.45). Because it carries a genuine weak signal under a different weather regime, it can finally test whether the strongest single feature shifts with the fire class — the question [0100] posed, now on an event where the detector has something to detect.
entry 0101
When does weather actually help? Three fires show the lift lives at the margin — and the strongest feature shifts with the event
Date: 2026-07-03 Status: SUPPORTED (replication + refinement across three independent fires) — it answers the open question from [0100] and confirms [0101] from the other side, while bounding the weather win of [0099]/[0100]. Builds on [0095], [0098], [0099], [0100], [0101]. Magnitude correction (2026-07-04): the reproducibility audit in [0103] shows the per-event caught-rates and the strong dose-response ordering below were single-run and within GPU noise; the corrected lifts are small (Gaetano +0.17, Agrigento +0.08) with overlapping bands. The gating claim (Catania, no signal → 0) is unaffected; the “dominant signal” label on Agrigento is corrected by de-duplication in [0103].
Why this entry exists. Entry [0100] ended with a specific question: does the strongest single weather feature shift with the fire class? Entry [0101] showed the weather lever does nothing without a weak signal to amplify. To answer the first and pressure-test the second, we needed a third fire that has a weak signal and is independent of the first. We pulled one from the ground-truth record — a citizen-reported fire in the Agrigento sector (37.57, 13.45) on 9–11 June, sixteen smoke/flame reports, later corroborated by a thermal pass — and ran the identical per-feature ablation. Put beside the two events we already had, the three now say something the single event could not.
BLUF. The fire-weather lift is not universal and not monotonic — it lives at the margin. It is decisive only when a weak signal is present but marginal; it does nothing when there is no signal, and almost nothing when the signal is already dominant. And the “strongest single feature” from [0100] is event-specific, not general: it shifts from cloud cover on one fire to temperature on another. So [0100]'s answer to its own question is yes, the top feature shifts.
Two findings, stated separately.(1) Catchability tracks signal presence — confirming [0101] from the catchable side. Agrigento's truth node carries a large citizen signal (citizen-proximity at the 100th percentile) and is caught (fused score 0.20, caught 0.23–0.37 over 30 seeds); Catania, with no signal, scores 0.0004 and is never caught. The two events bracket the gating claim: no signal → uncatchable and weather-inert; signal present → catchable. (2) The weather lift is largest at the margin. On Gaetano a single, bare citizen report needed the clear-sky context to be trusted, and weather more than quadrupled the catch rate (+0.7). On Agrigento the citizen signal is so strong the fire is already caught on it alone, and weather adds only +0.10 — real but small. With no signal (Catania) weather adds nothing. The lever matters precisely where a detection is marginal.
The feature shifts (answering [0100]). On Gaetano the strongest single feature was cloud cover — the marker of that specific clear-sky-at-fire-time event. On Agrigento it is temperature; cloud cover is mid-pack. So the [0100] ranking was a property of that fire, not a general law — which is exactly what [0100] flagged as the thing to check, and the check says the top feature is not stable across events. What generalizes is the block (weather as regime context), not any one variable.
Claim status: SUPPORTED (three-event replication/refinement). Robust conclusions: (i) catchability requires a weak signal (confirmed both directions now); (ii) the weather lift is non-monotonic in signal strength, largest for a marginal signal; (iii) the strongest single weather feature is event-specific, not fixed. What this bounds: the strong weather win of [0099]/[0100] is regime-specific (the marginal-signal regime), not a universal gain — and [0100]'s cloud-cover ranking is one event's ordering, not a rule.
Caveats, stated plainly: three events is a pattern, not a curve. Agrigento's citizen signal is an outlier — sixteen near-co-located reports inflate the count feature, so “dominant signal” is partly a clustered-report artifact and the count feature should be de-duplicated/capped. Agrigento's truth is placed at the citizen centroid (the thermal confirmation is ~13 km and a day later), and its absolute catch rate is low (0.23–0.37), so the small weather lifts there sit near the 30-seed noise floor (±~0.03–0.06); the safe reading is “small, not the +0.7 of Gaetano,” and “the top single feature is not the same across events,” not the exact per-feature ranking. The three fires also differ in signal type, so this is a natural-experiment comparison, not a controlled one.
What this does not claim: it does not overturn [0099]/[0100] — weather genuinely and reproducibly rescued Gaetano; it bounds where that gain applies. It does not claim weather is useless (it is the decisive lever in the regime that matters). It is still three events, none of them a deployed detector.
Reproducibility & why we publish it: the third-event replay was exported read-only from the ground-truth database under the same load-guarded pipeline, and run through the identical published harness (per-feature --weather_feats, 10- and 30-seed). We publish a result that bounds our own earlier win for the same reason we published the win: a measured “it only helps here, not everywhere” is exactly what stops the next person from over-generalizing the weather lever — or from trusting a single-event feature ranking.
Next research test: more events spread across the signal-strength axis to turn this three-point pattern into an actual dose-response curve; de-duplicate the citizen-count feature so a report burst does not manufacture an outlier; and carry the bounded claim — weather-as-regime-context helps a marginal detection cross the bound — into the camera/edge domain, where the marginal-signal regime is the common case.
entry 0102
A reproducibility audit of our own numbers: the weather win is real in direction, but a fraction of the magnitude we published
Date: 2026-07-04 Status: SUPPORTED (reproducibility audit) — it corrects the effect-size magnitudes in [0099], [0100], [0102], while leaving the gating result [0101] and the qualitative directions intact. Builds on all of [0099]–[0102]. Update (2026-07-04) — the deterministic re-run flagged below is DONE and confirms this entry. With deterministic GPU kernels (verified: identical caught-rates on repeated runs, 0.800 = 0.800), 60 seeds: Gaetano 0.600 → 0.800 (+0.20) — a real, robust lift matching the noisy estimate and refuting the +0.7 headline; Agrigento 0.283 → 0.167 (−0.12) — weather now hurts, versus +0.08 in the noisy run, so its sign is unstable and the honest reading is no reliable weather effect. Net: the weather lift is genuine only for Gaetano, the one true weak-lone-signal case; negligible elsewhere. The correction stands, sharpened.
Why this entry exists. While extending the study we noticed the same configuration, same data, and same random seeds produced different caught-rates on repeat runs. That is GPU-atomic nondeterminism (non-associative floating-point reductions in the scatter/message-passing kernels), and if our numbers move under it, then the single-run effect sizes we published need auditing before anyone builds on them. So we did the audit: we repeated the key measurements five times each at 30 seeds with the background set held fixed, changing nothing but the nondeterministic run. The headline effect does not survive at the magnitude we reported.
BLUF. The pipeline's run-to-run noise is large — the weather-conditioned Gaetano catch rate ranges 0.567–0.867 across identical repeats (spread 0.30). Re-estimated as the mean of five repeats, the weather lift is real and positive but roughly a quarter of the published headline: Gaetano 0.55→0.72 (+0.17), not the “0.2→0.9 (+0.7)” of [0100]; Agrigento 0.20→0.28 (+0.08), not [0102]'s tidy singles. Both lifts are positive in the mean, but their bands overlap and the difference between them is within noise — so the strong dose-response ordering of [0102] does not hold up either. What does survive: the gating result (no signal → a hard zero) and the de-duplication finding.
Why the noise is this large — and why it is on-theme. The variance is not a bug to be smoothed away; it is diagnostic. The confirmed fire sits right at the conformal decision boundary — a genuinely marginal detection — so tiny nondeterministic perturbations in training flip whether a given seed clears the bound. A robustly-detected fire would not swing 0.30 across identical runs; a marginal one does. The instability is itself evidence for the “marginal detection” framing the whole arc has been about — but it also means single-run caught-rates cannot be read to two decimals, which is exactly the mistake the earlier entries made.
The de-duplication finding, which does survive (a robust, beyond-noise effect). We also tested the [0102] caveat that Agrigento's citizen signal was inflated by a burst of co-located reports. Counting unique report locations instead of raw reports leaves Gaetano essentially unchanged (2 reports; catch 0.55→0.43, +weather 0.87→0.80 — within noise, the win intact) but collapses Agrigento from 0.23 to 0.00 without weather — a change far larger than the noise band. So Agrigento's apparent catchability really was propped up by duplicate reports; de-biased, it is a marginal-to-uncatchable signal, and [0102]'s “dominant signal” label was wrong. The count feature should be de-duplicated in the live pipeline.
What survives, what is corrected.Survives: (1) the gating result — Catania, with no weak signal, catches a hard 0 in every configuration and repeat ([0101] is unaffected; a floor of zero has no variance to worry about); (2) the direction of the weather effect — positive in the mean for both signal-present fires; (3) the de-duplication result. Corrected: the effect magnitudes in [0099]/[0100]/[0102] (Gaetano +0.17 not +0.7; Agrigento +0.08), and the strong dose-response ordering of [0102] (the Gaetano-vs-Agrigento lift difference is within noise). The single-run, low-seed numbers caught the optimistic tail of a wide distribution.
Claim status: SUPPORTED (audit). The correction is itself measured: five independent repeats per cell, fixed background seed (12345), identical replay artifacts, only the nondeterministic run varying. Caveat on the caveat: five repeats estimate the mean to roughly ±0.05; a definitive number wants deterministic kernels (torch deterministic algorithms) and/or 100+ seeds, which we have not yet run — so treat the corrected magnitudes as “small and positive,” not as new precise values to quote.
What this does not claim: not that weather is useless (its mean effect is positive in every event that has a signal); not that the pipeline is broken (GPU nondeterminism is expected — the failure was ours, in not quantifying it before reporting to three decimals); not that [0101]'s gating is affected (it is not). Still one detector, three fires, not deployed.
Why we publish a correction against our own headline: the entire point of this log is to save the next person the rework. A published effect size that does not reproduce is worse than no number, because someone will build on it. Auditing our own “0.2→0.9” and reporting that the honest figure is “0.55→0.72, and noisy” is the most useful thing we can put on the record — even though it deflates the most quotable result in the arc. Rigor is agreeing-or-not with our own hypothesis, measured; here the measurement disagrees with us, so it goes up.
Next research test: re-run the full arc under deterministic kernels at 100+ seeds to pin the corrected magnitudes; adopt multi-repeat bands as the standard for every future caught-rate on this page; and de-duplicate the citizen-count feature in the live pipeline before it can inflate an operational alert the way it inflated Agrigento here.
entry 0103
Carrying the weather-regime idea to the camera — and hitting an honest wall: the data we have cannot test it
Date: 2026-07-04 Status: HONEST NEGATIVE / bounding result — transfers the marginal-detection, regime-context idea of the fusion arc ([0100], [0103]) into the ground-sensor camera domain, and reports that it cannot be validated on the camera data currently in hand. No effect is claimed; instead we pin down exactly which data would let anyone test it.
The idea we tried to carry over. The satellite arc landed on one durable, deflated claim: a weather/regime context helps a genuinely marginal detection and does little elsewhere ([0103]). The natural next question for the planned Pi 5 + Hailo early-smoke cameras is whether the same is true on the ground: does a haze/clear-sky regime gate — raise the smoke-detection threshold when the scene is hazy, lower it when the air is clear — buy anything over a single fixed confidence threshold? Call it invention-dossier M1. The whole value of M1 would be suppressing false smoke in hazy/cloudy scenes while keeping true smoke, so testing it needs scenes with no fire as much as scenes with fire.
What we actually did. On real hardware, load-guarded off the mission system: we trained a small detector (YOLOv8n, 60 epochs) on the real PHOENIX ground-sensor smoke dataset (751 real images, pulled from Git-LFS — the first run silently trained on 130-byte LFS pointer stubs, which is its own lesson), then scored every validation image both for detection confidence and for a scene-haze proxy (dark-channel + contrast + saturation), and compared a fixed threshold against a haze-gated one.
Why it could not be tested — three measured reasons. (1) The dataset is all-positive. Every one of the 147 validation images contains smoke; there are zero fire-free frames. With no negatives you cannot measure a false-positive rate, and false-positive suppression is the entire point of M1 — so its core benefit is unmeasurable here by construction. (2) The detector saturates. On this set it reaches precision = recall = F1 = 1.000 at a plain 0.25 threshold; a regime gate has no headroom to improve a perfect score. (3) Haze does not behave as the hypothesis assumed. Detection confidence versus scene-haze has Pearson r = +0.16 — essentially flat, and if anything the haziest third of images scored slightly higher confidence (mean 0.69) than the clearest third (0.66), with near-identical miss counts at a fixed 0.5 cut (7/49 vs 6/49). And the haze range is narrow (0.50–0.68) because wildfire scenes are inherently smoky/hazy. So on this data haze is not a confound that degrades detection; it is correlated with the target.
The hard-negative test we tried, and why it too was uninformative. To get real fire-free frames we grabbed 100 live frames from a real Sicilian-adjacent volcano webcam (Etna, via the INGV public stream) as out-of-domain negatives. But the current view was dark/obscured (visible-panel mean brightness ~25/255), so it exercised neither the haze regime nor any smoke-like confuser — the smoke detector was correctly silent, which tells us nothing about M1. Dark is not the same regime as bright-and-hazy, which is exactly the regime M1 is meant for.
Claim status: NOT TESTED — reported as a negative so no one builds M1 on the assumption it was validated. What is measured and does stand: the available PHOENIX camera corpus is all-positive and haze-saturated, so it cannot discriminate a regime-gate; and on it, scene haze is positively (not negatively) associated with detection confidence.
What this bounds — the exact data that would settle it. M1 is testable only with a hard-negative, regime-diverse camera corpus: fire-free frames spanning clear sky, thin haze, cloud, dust and low sun, alongside true-smoke frames, all from the deployment's own optics and viewsheds. That corpus does not exist yet because the Pi 5 + Hailo ground sensors are not yet fielded — so the first operational job of those sensors is to log exactly these negatives (with timestamps and a weather tag) before any regime-gate is switched on. Until then, a fixed threshold is the honest default, and M1 stays an untested hypothesis, not a feature.
What this does not claim: not that a haze regime-gate is useless on the ground (the satellite analogue was real for the one marginal case); only that this dataset cannot show it either way. Not that the detector is good in the field — a 1.000 on an easy all-positive set is a warning sign about the set, not a virtue of the model. One tiny model, one easy dataset, no deployment.
Next research test: stand up the hard-negative logger on the first fielded sensor (auto-save fire-free frames binned by a haze proxy + local weather); re-run the fixed-vs-gated comparison once ~1k negatives across ≥3 haze bins exist; and only then decide whether M1 earns its place in the edge pipeline.
entry 0104
How much of the catch is the human? Removing the citizen signal collapses detection to a minority — and to zero where there was no human at all
Date: 2026-07-04 Status: MEASURED (deterministic kernels, 60 seeds) — an ablation that isolates the operational cost of the human citizen report, using the same corrected, deterministic pipeline as [0103]. It quantifies the vulnerability behind the fire that started this whole arc: the one that produced no citizen signal at all.
The operational question. The arc has shown that our catches lean on weak, corroborating evidence, and that a genuinely lone marginal signal is what the weather-regime context helps rescue ([0103]). But there is a blunter question a deployment has to answer: how much of what we catch is actually the citizen report, versus the satellite/auto machinery? If a fire generates a human report we do well; the fire that motivated this investigation (a real Sicilian wildfire near a populated area) generated none, and every automated feed missed it. So we ran the clean ablation: take each fire, hold everything else fixed, and zero out the citizen-proximity signal — then measure the deterministic catch rate with and without the human.
Result. Removing the citizen signal does not shave detection — it guts it for the catchable fires, and reveals a hard floor of zero for the fire that never had a human in the first place.
Fire (adgno / bg800 / NexCP / weather on / deterministic / 60 seeds)
Catch WITH citizen
Catch WITHOUT citizen
What the human carries
Gaetano (lone weak signal + a report)
0.800
0.217
−0.583 — ~73% of the catch
Agrigento (marginal + a report)
0.167
0.100
−0.067 — ~40% of a already-small catch
Catania (no signal, no report)
0.000
0.000
nothing to carry — the hard-zero floor
What the numbers say. For Gaetano, the human report is the detection: strip it and the auto-machinery (recurrence, spatial priors, weather regime, wind-diffusion coupling) recovers only 0.217 of the way — a real, non-zero residual, but barely a quarter of the cited-in catch. Agrigento was marginal to begin with and loses ~40% of its small catch. Catania is the point of the whole entry: with no weak signal and no human report, the pipeline sits at a deterministic 0.000 in both columns — the citizen ablation is a no-op because there was never a citizen signal to remove. You cannot lose what you never had, and you cannot fuse your way to a fire that left no trace in any feed. That is the uncatchable class, and it is exactly the class that burned.
Why this matters for what to build next. Two consequences fall out. First, the citizen channel is not a nice-to-have garnish on a satellite system; for the fires we actually catch, it carries the majority of the signal, so its reliability, latency and coverage are first-order engineering concerns, not app polish. Second — and this is the harder truth — leaning on the human means the Catania-class fire (rural, unwitnessed, sub-threshold) stays invisible no matter how good the fusion is, because fusion needs at least one weak signal to amplify and here there are none. Closing that gap cannot come from better fusion; it has to come from generating a signal where the feeds are currently silent (denser overhead revisit, a ground sensor in the viewshed, an active sub-threshold probe on clear-sky recurrence) so there is something for the human-independent path to catch.
Claim status: SUPPORTED. Deterministic kernels (verified reproducible per [0103]), 60 seeds, fixed background (12345), identical replay artifacts; only the citizen-proximity feature is ablated, everything else held constant. The Catania 0.000/0.000 is exact by construction (no citizen report exists to zero), consistent with the gating result of [0101].
What this does not claim: not that the automated feeds are worthless — they recover a real 0.217 on Gaetano without any human, and that residual is the seed a signal-generation program would grow; not that citizen reports are sufficient — they are absent exactly when a rural fire is most dangerous; not a deployed number — still one detector, three fires, replay not live. The residual auto-catch (0.217, 0.100) also inherits the run-to-run caveats of this pipeline, though under deterministic kernels the ordering here is stable.
Next research test: quantify how much a single added human-independent signal moves the Catania column off zero — inject a synthetic clear-sky overhead revisit or a single ground-sensor node into the Catania graph and measure the catch it unlocks. If one extra automated signal lifts an unwitnessed fire from 0.00 to even 0.2, that is the business case for the ground-sensor build, measured rather than asserted.
entry 0105
The human-independent path, measured: multi-sensor satellite cross-corroboration recovers 191 fires our own detectors missed — but 71% are agricultural, and only a land-cover gate isolates the 50 real wildfires
Date: 2026-07-04 Status: MEASURED (real PHOENIX artifacts: the FIRMS cluster shadow-catalog and internal-detector match in ground_truth.sqlite, ESA WorldCover 10 m land cover, the Sentinel-2 shadow-detector log) — the human-independent complement to the citizen ablation in [0105].
The operational question.[0105] left us with two classes: fires a human reports (which we catch well) and the Catania-class with no signal anywhere (uncatchable by fusion — it needs a generated signal). But there is a third class between them: a fire our own geostationary detectors cannot resolve, yet a different satellite instrument does see. If two or more independent instruments agree on a thermal anomaly our own machinery missed, can we recover it with no human at all? That is precisely the human-independent path [0105] said we would have to build.
Method. Surface a FIRMS cluster only when it clears a strict corroboration gate: ≥2 independent FIRMS instruments AND ≥2 separate passes AND non-recurring (the recurrence exclusion is non-negotiable — 53% of clusters are persistent refinery/flare sources) AND clear weather AND our own detectors missed it. Over ~2 weeks, 191 clusters pass. Then — skeptical-first — ask whether they are real, and why we missed them.
Validation check (191 multi-sensor confirmations)
Result
Reading
Industrial-flare false-positive leaks (within 3 km of a known refinery/flare)
0 / 191
the non-recurring gate holds
Mean independent instruments vs fires our detectors DID catch
What the numbers say. The 191 are real fires: zero industrial leaks, a multi-instrument signature stronger than the fires our own detectors resolve, dispersed across 46 rural areas, the strongest seen by six independent satellite systems at once. We missed them for a physical reason, not a bug — every one sits 100–1000× below the radiative-power floor of a 3 km geostationary pixel; the 375 m polar instruments resolve them and ours cannot. This is a working human-independent recovery path.
The deployability twist — process before you post. Raw, though, the path is not map-ready. Running ESA WorldCover over the 191 splits them sharply: 70.7% (135) are agricultural burns on cropland — real fires, but not wildfire threats — 26.2% (50) are wildland wildfires on tree/shrub cover, and 1.6% fall on built land (false-positive-prone, dropped). Post all 191 and you flood a wildfire map with stubble burns; a land-cover gate is what isolates the 50 that belong there. The filter removes irrelevant/false detects while retaining actual wildfires — the discriminator is where the fire is, not how hot.
The negative we owe the record. We also tested whether Sentinel-2 active-fire detection at 20 m could push below the polar-instrument floor toward the truly-unwitnessed class. A strict Schroeder–Giglio SWIR gate removes 96.3% of the S2 detector's output as sub-threshold false positives — a large, real precision gain — but the 3.7% that survive are only 0.5% corroborated by known fires, and zero appear at the reference wildfire after it burned. S2 active-fire is not a promotable standalone detector for this class; its honest role is a corroboration input, and the burn-scar (dNBR) route is the correct S2 path for the sub-polar-floor fire. Publishing this alongside the positive is the point: the confirmation path works, the S2-active-detector does not.
Claim status: SUPPORTED. Measured on real artifacts — the FIRMS cluster catalog with internal-detector match, ESA WorldCover 10 m, and the S2 spectral log — not asserted from memory. The 0/191 leak count, the 2.66-vs-1.92 instrument means, the sub-0.05 MW ceiling and the 96.3%/0.5% S2 figures are direct counts over the stored rows.
What this does not claim: not that all 191 are wildfires — 71% are agricultural burns, real fire but not the product's target; not that this reaches the Catania/reference class of [0105] — these sit below our floor but above the polar-instrument floor, whereas the fire that started the arc was below even that; not fully FIRMS-independent — the cross-instrument agreement is within the FIRMS family, so it corroborates the observation, not an orthogonal physics; and the map recovery is prospective — the historical 50 age out of the display window, so the value is new fires going forward, not a backfill.
Next research test: measure the operator-alert→action latency on the next live fresh wildfire the path surfaces, and — the harder gap — test whether the burn-scar dNBR route recovers the truly sub-polar-floor fire (the reference class) that active-fire detection provably cannot, quantifying the catch a post-fire scar analysis unlocks where every real-time feed was silent.
entry 0106
Which generated signal unlocks the unwitnessed fire? Only cross-sensor corroboration — recurrence, thermal and sensor-count do nothing
Date: 2026-07-04 Status: MEASURED (controlled signal-injection on the fusion model, deterministic-confirmed) — the controlled, mechanistic counterpart to [0106], answering the “which generated signal” question [0105] left open. Two independent methods — a real 191-fire shadow-catalog [0106] and this controlled injection on the reference fire — converge on the same answer: corroboration is the human-independent path. Update (2026-07-04) — magnitude CORRECTED by [0108]: the headline Catania lift below is an artifact of the feature-override injection, which isolates the signal to the truth node. Injected the way the real pipeline computes corroboration (a source → near_count, spread over 8 km), one–three corroboration sources lift the unwitnessed Catania fire by 0.00, not to 0.70. The corroboration effect is real only for fires that already carry a partial signal (Agrigento 0.23→0.38). The qualitative claim — corroboration is the human-independent path for fires that have some signal — stands; the “catches the truly-unwitnessed fire” reading does not.
The question [0105] forced. The no-citizen ablation showed the Catania-class fire (no human report, no weak signal in any feed) sits at a deterministic 0.000 — uncatchable by fusion because there is nothing to fuse. It also showed the automated machinery recovers a real 0.217 on Gaetano without any human, so a human-independent path exists. The open question was practical: if we are going to generate a signal for the unwitnessed fire (a ground sensor in the viewshed, a denser overhead revisit), which signal actually moves the needle? Not all automated evidence is equal, and building the wrong sensor is expensive.
Method. We inject a single synthetic human-independent signal at the Catania truth node — a raw-feature override before standardization, so it flows through the same pipeline — and sweep the signal type and strength, measuring the deterministic catch rate. Only automated channels are injectable (cross-sensor corroboration, overhead-revisit recurrence, multi-sensor count, thermal FRP); the human citizen channel is never touched. Non-deterministic 60-seed for the dose-response shape, deterministic 60-seed anchors to confirm the lift is real and not the run-to-run noise of [0103].
Injected human-independent signal at the Catania truth node
What the numbers say. Of every human-independent signal we can inject, only cross-sensor corroboration lifts the unwitnessed fire off zero — and it does so decisively, from a hard 0.000 to ~0.70 with a single independent confirmation (deterministically 0.750 at strength 2, so the lift is real, not noise). One corroboration is enough; a second adds nothing and a third slightly hurts (pushing the feature past where the training positives lived). Recurrence, sensor-count and thermal FRP inject to 0.000 at every strength — they do not move the fusion decision at all. The combos catch exactly when they contain corroboration and no more strongly for the extra channels, which pins corroboration as the causal ingredient rather than “more signal in general.”
Why this matters — and how it converges with [0106]. Concurrently, [0106] measured the human-independent path on real data: a strict multi-sensor corroboration gate (≥2 independent FIRMS instruments, ≥2 passes, non-recurring) surfaced 191 real fires our own detectors missed, better-corroborated than the fires we do catch. That is the empirical existence proof; this entry is the controlled mechanism. Two different methods — a real shadow-catalog and a synthetic injection on the exact reference fire — independently single out the same signal. So the deployment directive is now specific and doubly-supported: a generated signal only helps if it corroborates the detection at the fire location — a second independent sensor agreeing on the same spot. A ground node or extra revisit that merely adds recurrence history, a sensor tally, or a thermal reading — without providing that independent locational confirmation — would not lift the Catania class.
Claim status: SUPPORTED. Deterministic anchors confirm the floor (base 0.000) and the lift (corroboration×2 = 0.750, combo = 0.650, both reproducible); the non-deterministic sweep supplies the dose-response shape with the usual [0103] noise caveat. The null channels (recurrence/count/FRP = 0.000) are exact across all seeds.
What this does not claim. The injection is a feature-level override at the truth node — a clean first measurement, not yet a full simulated sensor with its own graph node and wind/space edges (that is the next test, and it could change the magnitude). And the result is conditional on what this trained detector learned: it responds to corroboration because its positives were corroboration-characterized, so “recurrence/thermal don't lift” is as much a statement about the training set as about physics — making lone recurrence or lone thermal catchable would require retraining on positives of that kind. Per [0106], even a generated corroboration still needs a land-cover gate downstream to separate wildfire from the 71% agricultural burns. Still one detector, replay, three fires, not deployed.
Next research test: replace the feature-override with a real injected node — a synthetic ground-sensor detection at the fire location, wired into the graph with its true spatial and wind edges — and confirm the corroboration lift survives the full relational mechanism; then repeat on Gaetano and Agrigento to see whether one generated corroboration also hardens the marginal catches, and cost the minimum sensor that delivers it.
entry 0107
Correcting our own headline: injected the way the pipeline really works, corroboration does not catch the unwitnessed fire — and retraining doesn't either
Date: 2026-07-04 Status: SUPPORTED (correction, deterministic-confirmed) — it executes [0107]'s own next test (replace the feature-override with the real relational mechanism) and finds the test overturns 0107's magnitude. The corrected result strengthens[0105]/[0106]: the truly-signal-less fire is harder to catch than we reported, not easier. Update (2026-07-04) — resolved by [0109]: the 0.00 here is not fundamental — it is the pipeline's 8 km corroboration smearing. Shrink the aggregation radius and the unwitnessed fire becomes catchable: at a location-faithful ~1 km radius one corroboration lifts Catania 0.00→0.75. So a location-specific ground sensor can catch the Catania class; this entry's “can't” holds only for corroboration smeared over 8 km.
Why this exists.[0107] reported that injecting one cross-sensor corroboration lifts the unwitnessed Catania fire from 0.00 to ~0.70, and flagged the caveat that the injection was a feature-override — it set the truth node's standardized corrob_n directly rather than adding corroboration the way the pipeline computes it. So we did what the entry promised: inject a real corroboration source and let the pipeline's own near_count aggregation turn it into the feature. The lift disappears.
Catania (deterministic 60-seed unless noted)
Catch
Reading
feature-override, corrob_n=1 (the 0107 method)
0.650
reproduces 0107 — the artifact
real mechanism, 1 corroboration source (near_count)
0.000
no lift
real mechanism, 2 sources
0.000
no lift at higher dose
real mechanism, 3 sources
0.000
still nothing
+30 / +60 synthetic lone-thermal positives, then inject FRP
0.000
retraining doesn't transfer
+30 / +60 synthetic lone-recurrence positives, then inject recurrence
0.000
retraining doesn't transfer
Why the override lied. Setting corrob_n=1 on the truth node alone makes corroboration uniquely high there, so after standardization the truth node stands out sharply. But the pipeline doesn't work that way: a corroboration source is aggregated by near_count over an 8 km radius, so it raises corrob_n for every node in the neighborhood, not just the fire. Once the whole neighborhood shares the signal, it no longer distinguishes the fire — standardization washes it out, and the catch stays at zero. The 0.70 was a property of the injection shortcut, not of corroboration.
What corroboration does do — and it is real. Run the same real mechanism on the fires that already carry a partial signal, and it helps: Agrigento (marginal) lifts 0.233 → 0.383 deterministically, Gaetano (already catchable) 0.750 → 0.783. So corroboration amplifies an existing weak signal; it cannot manufacture one. That is exactly the pattern [0106] saw empirically (its corroboration gate recovered fires that were already polar-detectable, never the truly-invisible class), and it is the fusion principle stated plainly: fusion needs something to fuse.
Retraining doesn't rescue it either. We tested whether “only corroboration works” was a training-set artifact by adding 30–60 synthetic lone-thermal and lone-recurrence positives, teaching the model that a single channel can mean fire, then injecting that channel at Catania — at matched strength. It stays at 0.000 in every case (while a corroboration override still lifts, 0.425, confirming the model is otherwise responsive). So the unwitnessed fire's resistance is not a missing-training-example problem.
Claim status: SUPPORTED (correction). Deterministic kernels, fixed background, identical replay; the override-vs-mechanism gap (0.650 vs 0.000) and the Agrigento hardening (0.383) are reproducible. A methodological note also fell out: injecting the sensor as a labelled graph node is ill-posed — a label-0 co-located node sabotages the catch to 0.000 (it teaches “detections here are negative”), and a label-1 node would be circular (telling the model the answer). Corroboration is properly an evidence feature, not a node.
What this corrects and what stands.Corrected: 0107's headline that one generated corroboration catches the unwitnessed fire (0.00→0.70) — under the real mechanism it is 0.00→0.00. Stands: that corroboration is the human-independent signal the fusion decision responds to ([0107]), and that it meaningfully hardens fires with a partial signal. Strengthened:[0105]/[0106] — you cannot fuse, corroborate, or retrain your way to a fire that left no signal anywhere.
What this does not claim: not that a ground sensor is useless — but it says how it must be wired: its detection has to enter the pipeline as location-specific evidence the fire owns uniquely (a tight-radius or node-attached corroboration), or as a trusted primary detection at that exact spot, not smeared over an 8 km neighbourhood where it dissolves. Still replay, one detector, three fires.
Why we publish this against our own entry: same discipline as [0103] — a headline that only holds under an injection shortcut is worse than no number, because someone would size a sensor programme against a 0.70 that isn't there. The honest figure is 0.00 under the real mechanism, and the honest implication is sharper: fixing the truly-unwitnessed fire needs location-faithful signal registration, not just “add corroboration nearby.”
Next research test: implement location-specific corroboration (shrink the aggregation radius, or attach the corroboration to the fire node directly) and re-measure the Catania lift; and test the honest “the sensor IS the detection” model — a trusted ground-sensor positive at the exact fire location — separating a real deployed detection from mere nearby corroboration.
entry 0108
The unwitnessed fire is catchable — with a location-faithful sensor: shrinking the corroboration radius lifts Catania 0.00 → 0.75
Date: 2026-07-04 Status: SUPPORTED (deterministic) — it resolves the open question [0108] left: is the unwitnessed fire's 0.00 fundamental, or an artifact of the pipeline smearing corroboration over 8 km? It is the smearing. This closes the arc [0105]→[0108] and turns the ground-sensor case from “can't help” back to “can — if wired right.”
The question [0108] forced. 0108 showed that adding one corroboration the way the pipeline actually computes it — a source aggregated by near_count over an 8 km radius — does nothing for the unwitnessed Catania fire (0.00), because the corroboration spreads across the whole neighborhood and no longer distinguishes the fire. That left a fork: either the unwitnessed fire is fundamentally unreachable, or the 8 km radius is simply too coarse. The difference decides whether a ground sensor is worth building. So we swept the radius.
Corroboration near_count radius (1 source at the fire, deterministic 60-seed)
“sensor IS the detection” — a trusted positive node at the fire, no corroboration feature
0.000
What the sweep says. The catch is flat and near-zero while the radius is coarse (8 km, 4 km → 0.017), then climbs steeply through 2 km (0.150) to a peak at 1 km (0.750), and plateaus around 0.63 for anything tighter. So the unwitnessed fire's 0.00 was never fundamental — it was the 8 km aggregation dissolving the signal. Register the same one corroboration at a location-faithful ~1 km radius and the truly-unwitnessed fire becomes catchable at 0.63–0.75, deterministically.
The subtle part — and it is a precise deployment spec. The “sensor IS the detection” variant — injecting the sensor as a trusted positive node at the exact fire location — catches nothing (0.000). A co-located positive neighbor does not propagate enough through the graph to lift the fire's own node. What works is the sensor feeding the fire node's own corroboration feature, tightly localized. So the integration rule is specific: a ground sensor helps only when the pipeline ingests its detection as location-specific corroboration of the fire's node (a ~1 km near_count), not smeared over 8 km and not dropped in as a disconnected positive.
Claim status: SUPPORTED. Deterministic kernels, fixed background, identical replay; the monotone radius→catch curve (0.017 at 8 km → 0.750 at 1 km) and the 0.000 for the standalone-positive variant are reproducible. Together with [0108]'s override-vs-mechanism control, this isolates the effect to the spatial locality of the corroboration, not its mere presence.
How this closes the arc.[0105]: the unwitnessed fire is uncatchable by fusion of existing feeds (true — there is nothing to fuse). [0107]: a feature-override made it look catchable (artifact). [0108]: the real 8 km mechanism catches nothing (correction). 0109: a location-faithful (~1 km) corroboration catches it, 0.00→0.75 — so the fix is not “more fusion” but a generated, tightly-localized signal. That is the measured green light for a ground sensor in the fire's viewshed, with an exact integration requirement attached.
What this does not claim: not certainty — 0.63–0.75 is a strong lift, not 1.0, so even a location-faithful sensor makes the fire likely caught, not guaranteed; not that the current live pipeline already does this — it uses 8 km, so the pipeline change (per-source tight-radius corroboration) is itself a required step; still replay, one detector, three fires, not deployed.
Next research test: implement location-specific corroboration in the pipeline (a tight radius for trusted point-sensor sources, keeping 8 km for coarse satellite corroboration), re-measure across Gaetano and Agrigento, and pair it with the physical ground sensor whose viewshed defines the ~1 km locality — the Cianciana camera being the concrete instance.
entry 0109
The night camera was below floor too — the fire-night Day-Night Band granule posted, the glow still is not in it, and the bright-night fix we built cannot, by construction, reach a fire nothing else saw
Date: 2026-07-06 Status: defensible negative — closes the one hypothesis [0095] left open. The fire-night VIIRS Day-Night Band granule has since posted and been reprocessed at the witnessed point; it is empty there, and the general bright-night recovery step built afterwards is shown to be structurally unable to catch this class of fire. Bounded to one fire, one night, one location.
The analogy.[0095] ended with a single instrument still untested: the night camera that sees the visible glow of flames rather than their heat, and so is not bound by the thermal floor that blinded both geostationary satellites. The glow image for the fire night has now arrived. We re-ran it at the forest ranger's exact spot. The fire is not there either. And there is a sharper lesson underneath: the fix we built afterwards to make that night camera work on bright, town-lit summer nights only rescues a faint glow when something else already flagged a fire nearby to aim it at — and the entire point of this fire is that nothing did. The tool built for bright nights therefore cannot, by its own design, catch a fire that is genuinely unwitnessed. That is not a bug to fix; it is a boundary to state plainly.
BLUF. The fire-night VIIRS Day-Night Band granule (VNP02DNB.A2026182.0100, and the preceding night A2026181.0118) posted and was ingested. Both tripped the persistent-light candidate cap after masking (~1695 and ~1579 candidate pixels against a 500 cap) on a moonlit, town- and coast-lit summer night, and were discarded whole — the exact failure mode [0095] flagged. The mask-before-cap reorder from [0095] was insufficient: the residual anthropogenic glow alone still overruns the cap. The DNB detections that did ingest for the window sit ~60 km north over Palermo. A dedicated reprocessing that un-blinds the granule (keeping only sparse-rural candidates) puts the nearest DNB candidate ~8.9 km from the witnessed point — no hit. So a third independent physics — night-glow radiance, after the two geostationary thermal imagers of [0095] — is null at a ground-truth-confirmed clear-sky fire. The DNB hypothesis of [0095] is therefore NOT supported: this fire is below the night-glow floor as well, consistent with its sub-hectare thermal floor [0091].
The structural finding — a boundary, not a tuning knob. When the persistent-light cap trips on a bright night, the safe way to still recover a faint fire glow is prior-anchored: keep only candidates within a few kilometres of an already-active fire prior (a corroboration from another sensor or a ground report), and discard the rest as city lights. We built exactly that, and it is the right general bright-night recall fix — it un-blinds dense granules without flooding the map with town lights. But it recovers a fire only if a prior already points at it, and the defining property of this fire — and its whole class — is that no other instrument saw it, so there is no prior to anchor to. Verified both ways: with no active prior the recovery keeps nothing (no false flood); inject a prior at the point and it recovers candidates there. Either way the fire's nearest DNB candidate is ~8.9 km out — beyond the recovery radius — so even a hypothetical prior would not have rescued this specific glow. A prior-anchored recovery raises recall for fires that are already partly corroborated, and by construction does nothing for the truly-unwitnessed fire.
The operational consequence. This nails the detection path for the class. Three space physics — SEVIRI 3.9 µm thermal, MTG-FCI 3.8 µm thermal [0095], and VIIRS DNB night-glow — are each below floor at a witnessed clear-sky fire. The catchable path is not a better orbital threshold; it is a location-faithful ground signal fused as tight (~1 km) corroboration of the fire's own node [0109], with the next-day Sentinel-2 SWIR / dNBR burn scar as physical confirmation. The night camera helps corroborated fires; it does not rescue the unwitnessed ones — which is precisely why the ground sensor of [0109], not another satellite fix, is the measured answer for this class.
Reproducibility — data and method (do this yourself).
Task: pull the public VNP02DNB fire-night granule over Sicily, apply a persistent-light mask, and read the candidate field at the witnessed coordinates and their neighbourhood; then test whether the over-cap recovery (keep-near-active-prior) changes the verdict with, and without, a prior injected at the point.
Discipline: report the granule identifiers and the nearest-candidate distance; name the recovery step's structural limit rather than banking the fix as a win; leave the fire's size unmeasured (a ground eyewitness gives none).
Provenance: NASA VIIRS/NPP VNP02DNB (LAADS DAAC); ground truth is a forest-ranger eyewitness report (no personal data published). The geostationary companion reprocessing scripts are [0095]'s: SEVIRI · FCI.
Claim status: defensible negative — the Day-Night Band is below floor at the witnessed point (nearest candidate ~8.9 km), and the bright-night recovery is prior-anchored and therefore structurally unable to catch a zero-prior fire. Bounded to one fire, one night, one location, size unmeasured.
Current literature & PHOENIX alignment. Verdict: AGREES with the nighttime fire-detection state of the art. The VIIRS Day-Night Band detects sub-thermal-floor combustion glow [9], but its nighttime fire detection is confounded by lunar illumination and dense anthropogenic light [11] — a small rural fire competing with town and coastal glow on a moonlit night is exactly the regime where DNB fire detection is hardest. Our result is consistent: no separable fire candidate appears at the point above the persistent-light field.
What the external literature reinforces: that DNB extends fire detection below the thermal floor, but its false-alarm control on bright nights depends on masking persistent light [9][11] — the very masking that forces the candidate cap, which is what discards the town-saturated granule.
Where PHOENIX is stricter or diverges: we reprocessed the actual fire-night granule at the witnessed point rather than inferring from cadence; we reported that our own [0095] reorder fix was insufficient; and we disclosed that the bright-night recovery we built cannot, by design, reach the very class of fire that motivated it — instead of quietly counting the fix as a win.
What this post does not claim: not that DNB is useless (it recovers corroborated bright-night fires, and the prior-anchored recovery is the correct general fix); not that the fire emitted no glow at all (only that no candidate is separable at the point above the town-light field); not a fire size.
Next research test: the location-faithful ground signal [0109] and the next-day Sentinel-2 dNBR burn scar are the remaining detection paths for this class — wire the tight-radius corroboration into the live pipeline and pair it with the in-viewshed ground camera whose ~1 km locality it depends on.
Public data sources:NASA LAADS DAAC VIIRS/NPP VNP02DNB (Day-Night Band), and NASA FIRMS (VIIRS/MODIS NRT). The verdict re-derives from the public granule: the persistent-light density that trips the cap, and the ~8.9 km nearest-candidate distance, are both readable from VNP02DNB.A2026182 without any PHOENIX infrastructure.
Method note: the ~8.9 km nearest-candidate distance is measured on the un-blinded granule; the “structurally cannot catch a zero-prior fire” statement is a property of the recovery rule (recover-only-near-active-prior), verified directly with and without an injected prior at the point.
entry 0110
Waiting for a second sensor catches 1% of fires in real time; a calibrated model catches 4× more — and its “unverifiable” flags turn out to be deferred confirmations, not false alarms
Date: 2026-07-06 Status: defensible — a retrospective shadow comparison of two surfacing methodologies over 4,831 model-scored candidate events, with truth taken from 72-hour, 14-day and 45-day reconciliation; the key uncertainty (the “unverifiable” tail) is measured directly by extending the reconciliation horizon. Bounded by a proxy ground truth and a 45-day window that has not yet fully elapsed. Extends the ground-signal locality result [0109].
The analogy. There are two ways to decide a detection is real enough to put in front of a firefighter. You can wait for a second, independent instrument to agree — corroboration, which is almost never wrong. Or you can trust a well-calibrated model’s confidence. The catch is that waiting for a second sensor is almost never wrong and almost never in time: on our own history it flags about one fire in a hundred while it is still burning, and everything else is only “confirmed” days later, once a burn scar appears in the satellite imagery. So we measured what a calibrated model would surface on its own, and — the part that actually decides the question — we went back and checked whether the detections we couldn’t immediately verify were quietly false alarms, or just real fires whose scar had not landed yet.
BLUF. Population: 4,831 model-scored candidate events (2,078 later confirmed real, 115 refuted, 2,638 initially unverifiable at 72 h). Methodology A — corroboration-gated surfacing (an event reaches the map/alerts only when an independent sensor family agrees): perfect precision, but it surfaces just 38 events and 1.0% of the fires in real time. The rest are confirmed only retrospectively. Methodology B — let a calibrated ensemble surface its own high-confidence, uncorroborated detections: at a probability threshold of ≥0.9 it surfaces 4× the real-time catches (2.9% recall) with exactly one measured false alarm across the whole 6-week window; at ≥0.8, 4.2% recall for three false alarms. The production transformer, run the same way, collapses back to the 38-event corroboration set at any useful threshold — it is useless as a surfacing gate, so if you surface on a model score at all, it must be the calibrated ensemble. The decisive result is the “unverifiable” tail. Extending reconciliation from 72 h to 14 days resolved 39 of the 86 unknowns at ≥0.8 and 17 of 46 at ≥0.9 — every single one toward confirmed, none toward refuted — lifting measured precision to 97–98% and still climbing (the 45-day horizon has not yet elapsed). The unknown was not hiding false alarms; it was hiding real fires waiting for a scar.
The comparison (real-time surfacing; truth from delayed reconciliation).
Resolving what we don’t know (the honest part). The obvious objection to B is the unverifiable column: an event with no post-fire scene can’t be scored, so a precision computed only on resolved events could flatter it. We tested that objection head-on by re-scoring B’s uncorroborated set at the 14-day horizon. At ≥0.9, the 87 events went from 40C / 1R / 46 unknown (72 h) to 57C / 1R / 29 unknown (14 d): 17 unknowns resolved, all confirmed. At ≥0.8, 39 of 86 unknowns resolved, all confirmed. This is the mechanism that answers the objection: a longer-horizon reconciler is a self-correcting path — it upgrades true model-surfaced detections to confirmed as their scars land, and would retract a false one, and empirically the direction is overwhelmingly toward real. So B’s residual risk is small (about one false alarm per six weeks at ≥0.9) and auto-retracting, not an open-ended false-alarm faucet.
The design this implies. Pure A is safe and adds almost no early-warning value — the model’s measured advantage never reaches the map. Pure B at a low threshold starts surfacing large unverified volume. The measured sweet spot is B at a high threshold (≥0.85–0.9), presented as a distinct, lower-confidence tier that is explicitly labeled model-flagged-and-uncorroborated, with the longer-horizon reconciler promoting or retracting each one over the following weeks. That keeps the meaning of a fully-corroborated “confirmed” intact (corroboration still earns the top tier) while letting the model’s early catches through under an honest label — the same “a generated signal, precisely scoped” lesson as [0109], applied to model confidence instead of a ground sensor.
Reproducibility — method (do this yourself).
Task: over model-scored candidate events, define surfaced-by-A = an independent-sensor-family corroboration exists; surfaced-by-B = corroborated OR calibrated score ≥ τ. Score against reconciliation outcome (confirmed / refuted / unresolved) at 72 h, then re-score the unresolved at 14 and 45 days. Report precision on resolved events and real-time recall against all eventually-confirmed fires.
Discipline: report the unverifiable column, don’t hide it in the denominator; test it by extending the horizon rather than assuming; sweep the threshold; include the incumbent model as a control (it fails as a gate); state that truth is a delayed proxy and the 45-day horizon is still filling.
Provenance: model-scored candidate events graded against Sentinel-2 SWIR / dNBR burn scars, SAR change, and fire-brigade reconciliation; no personal data.
Claim status: defensible — corroboration-gating yields ~1% real-time recall at perfect precision; a calibrated ensemble surfacing uncorroborated detections at ≥0.9 yields ~4× the real-time catches at ~98% measured precision with ~1 false alarm per six weeks; the unverifiable tail resolves toward confirmed under longer-horizon reconciliation. Bounded to one region’s candidate stream, a delayed proxy truth, and a 45-day window not yet fully elapsed.
Current literature & alignment. Verdict: AGREES. Multi-sensor corroboration is the standard route to low-false-alarm fire products but pays for it in latency and missed small events; calibrated single-model detection with post-hoc verification is the recognized complement for early warning. Our measurement is the concrete trade curve between the two on one operational stream, plus the specific finding that the “unverifiable” residue is deferred confirmation rather than hidden error.
What the external literature reinforces: that corroboration reduces false alarms at a latency and small-fire-recall cost, and that probability calibration is what makes a single model’s confidence safe to threshold for surfacing.
Where this is stricter or diverges: we did not accept the model’s resolved-only precision at face value — we stress-tested the unverifiable tail by extending the reconciliation horizon, and we keep corroboration as the top tier rather than letting a model overwrite the meaning of “confirmed.”
What this does not claim: not that the model should replace corroboration (it should ride a distinct, clearly-labeled lower-confidence tier); not that the unverifiable tail is fully closed (the 45-day horizon is still elapsing, though every resolution so far is a confirmation); not that a candidate-stream recall figure equals whole-map recall.
Next research test: deploy B at ≥0.9 as a self-correcting model-flagged tier behind a reversible flag, keep the incumbent as fallback, and measure the live precision/recall and the 45-day resolution of the flagged set against this retrospective estimate.
Public data sources:NASA FIRMS (VIIRS/MODIS), Copernicus Sentinel-2 (SWIR / dNBR burn scar) and Sentinel-1 (SAR change), used as delayed reconciliation truth. The A-vs-B trade curve reproduces from any model-scored event log carrying a multi-horizon reconciliation outcome.
Method note: precision is computed on resolved events only (confirmed vs refuted); the unverifiable count is reported separately and probed by horizon extension, not folded into precision. “Real-time recall” is catches-at-surfacing over all eventually-confirmed events, so absolute values are low by construction — the comparison is A-vs-B on the same denominator.
entry 0111
Two follow-throughs from the surfacing comparison: the calibrated tier is now live as a hidden, self-retracting lane — and the detectors themselves carry only about 1% of real-time recall
Date: 2026-07-08 (deployment 2026-07-07) Status: engineering + measurement — part (1) is a reversible, flag-gated deployment; part (2) is a retrospective measurement over 5,984 scar-confirmed fires, bounded by a proxy ground truth. Follows the A-vs-B surfacing result [0111].
The analogy. Entry [0111] settled which way to decide a detection is real enough to show a firefighter; this is what we did next. Two things. First, we actually switched on the calibrated model’s high-confidence tier — but as a separate, clearly-labelled “flagged by the model, not yet corroborated” lane that can never pass itself off as a corroborated confirmation, and that quietly withdraws itself if later reconciliation refutes it. Second, we asked a harder question about our own eyes: of all the fires we now know were real, because a burn scar eventually confirmed them, how many did the machine-learning detectors actually flag at the moment they were burning?
BLUF.(1) Deployment. The calibrated ensemble’s ≥0.9, uncorroborated detections now surface as a distinct tier, flag-gated and reversible. By construction an uncorroborated detection cannot earn the corroborated “confirmed” label — so it lands in the lower-confidence, hidden-by-default lane, where the multi-horizon reconciler promotes it if a second sensor or a scar later agrees and removes it if reconciliation refutes it. Self-correcting by design; the anti-false-alarm meaning of “confirmed” is left untouched. (2) Measurement. Over 5,984 fires that reconciliation later confirmed real, the production detector scored above its operating threshold on just 14 of them, and the calibrated ensemble at ≥0.9 on 57 — about 1% either way. The other ~99% reached the map through cross-sensor corroboration or retrospective recovery, not through a detector firing in the moment. The average calibrated ensemble score on confirmed fires was only 0.36. In other words: corroboration, not the single-frame detector, carries essentially all of our real-time recall.
Why this matters. It relocates the next improvement. The surfacing logic is settled ([0111]): a calibrated tier adds several times the real-time catches at high precision, and its “unverifiable” flags turn out to be deferred confirmations rather than hidden false alarms. But the detectors underneath are the weak link on recall — they simply do not recognise most real fires at detection time. The highest-leverage next step is therefore not the decision rule but the detector: retraining it on the now-substantial corpus of scar-confirmed fires it currently misses, with the known false-positive catalogue as negatives. That is a hypothesis about the next test, not a result.
Reproducibility & honest bounds. Truth is the same multi-horizon reconciliation used in [0111] (72-hour / 14-day / 45-day), so “confirmed real” is a proxy that grows over time, not an oracle, and the 45-day window has not fully elapsed for the most recent events. The “~1% detector recall” figure is real-time single-detector recall against scar-confirmed fires — it is emphatically not the system’s overall recall, which is far higher precisely because corroboration and recovery do the heavy lifting. The deployment is a hidden canary: the flagged tier is computed and stored but not shown by default, so no field behaviour has changed yet.
Claim status. (1) reversible engineering deployment; (2) measured retrospective finding on a proxy truth.
Current-literature verdict: AGREES. That multi-sensor corroboration dominates single-detector recall for small and early fires, and that any one instrument misses most incipient fires in a single pass, is well established in operational fire detection.
What the literature reinforces. Fusion over independent sensors is the standard route to recall; single-frame detectors trade recall for precision.
Where we are stricter. We keep the corroborated “confirmed” label sacred and put the model’s solo calls in an explicitly separate, self-retracting lane, rather than blending model confidence into the confirmed set.
What this does NOT claim. It does not claim a retrained detector will close the gap (that is the next test), nor that the canary improves field outcomes (no operational verification yet), nor that the ~1% figure reflects overall system recall (it does not).
Next test. Retrain the detector on the scar-confirmed corpus plus the false-positive catalogue; measure recall lift and false-alarm cost on a held-out set; verify the canary against the live map before ever making it visible.
Method note. Counts are over model-scored candidate events; “operating threshold” is the production detector’s deployed cut; the calibrated ensemble uses isotonic calibration with a ≥0.9 probability gate as in [0111].
entry 0112
The production classifier can’t tell a confirmed fire from a false alarm (0.078 vs 0.080); a retrained re-ranker can — and a season-neutral truth check shows the gain is real, not a confirmation artifact
Date: 2026-07-08 14:10 UTC Status: defensible — a retrospective 5-fold spatially-grouped cross-validation over 12,566 labelled candidate events, a two-truth de-confounding test, and a reversible shadow deployment verified end-to-end in the operational system. Bounded by a proxy ground truth and a season-neutral truth that is sparse (117 events). Follows the detector-recall finding [0112] and the surfacing comparison [0111].
The analogy.[0112] showed our detectors carry only ~1% of real-time recall — corroboration does the rest. That raised an obvious question: when a real fire does reach our machine-learning scorer, does the scorer recognise it? We checked, and the answer is worse than expected: the production classifier gives a confirmed fire and a proven false alarm almost the same score. It is, for ranking purposes, barely better than a coin. So we retrained a re-ranker on the fires we now know were real — and then, because a big gain is exactly when you should be most suspicious, we ran a de-confounding test to check whether the gain is real fire behaviour or just our own confirmation machinery talking.
BLUF. On 12,566 labelled candidates (6,174 reconciliation-confirmed real, 6,392 false-alarm / uncorroborated), the deployed classifier ranks real fires at chance: AUC 0.514 against burn-scar-reconciled truth and 0.330 (worse than random) against a season-neutral truth. In the live table it scores confirmed fires at avg 0.078 and refuted false alarms at 0.080 — indistinguishable. A re-ranker retrained on the confirmed corpus with non-leaky, detection-time features reaches AUC 0.868 (burn-scar) and 0.817 (season-neutral). The improvement survives de-confounding: detection features alone lift the season-neutral AUC to 0.731 (vs the classifier’s 0.330), and season proves to be real climatology, not a confirmation artifact. It is deployed as a hidden, reversible shadow — nothing user-facing yet.
What we measured
Population & labels. Every model-scored candidate with a location. Positive = confirmed real by 72-hour / 14-day / 45-day reconciliation; negative = explicitly refuted, or uncorroborated and never confirmed. Balanced by construction: 6,174 positive vs 6,392 negative (49% base rate).
Features (non-leaky, detection-time only). Two families, all available before any confirmation: (i) detection-intrinsic — which detector fired, fire radiative power, brightness temperature, persistence, detection confidence, below-comparator-floor flag, coverage flag; (ii) context / priors — land-cover biome, wildland-urban class, hour, month, latitude, longitude. All confirmation signals (burn scar, SAR change, corroboration count, verification tier) are excluded from features — they define the label, so using them would be circular.
Protocol. Calibrated gradient-boosted trees, isotonic calibration, 5-fold cross-validation grouped by 0.2° spatial cells (so a model is never tested on a location it trained on). Scored head-to-head against the two production scores on the same events.
Model
AUC — burn-scar truth
AUC — season-neutral truth
re-ranker — all features
0.868
0.817
re-ranker — detection features only
0.62
0.731
re-ranker — priors only (season/geo)
0.856
0.818
re-ranker — month only
0.432
0.665
production classifier A
0.514
0.330
production classifier B
0.484
0.355
Operational discrimination (live scores by real outcome). Confirmed fires: re-ranker avg 0.833, production 0.078. Refuted false alarms: re-ranker 0.038, production 0.080. Uncorroborated: re-ranker 0.149, production 0.064. The production classifier assigns confirmed fires and proven false alarms the same score; the re-ranker separates them by a factor of ~20.
The de-confounding — is the gain real, or our own confirmation bias?
A large prior-driven gain is suspect, because our primary confirmation (burn scars from short-wave infrared) works far better in summer over vegetation — so “confirmed” can secretly encode “summer + vegetated” rather than “real fire.” To separate the two we re-graded against a season-neutral truth: independent polar active-fire corroboration, whose satellites overpass year-round regardless of season. Two diagnostics settle it:
Season is real climatology, not an artifact. Against the season-neutral truth, month alone scores AUC 0.665 and genuinely-confirmed fires are 91% summer vs 47% for non-fires (+44 points). Season is a legitimate, valuable attribute and earns its place in the model.
The burn-scar prior lift was geography, and partly confounded. Against burn-scar truth, month is actually anti-predictive (AUC 0.432; scar confirmations lag into autumn while summer heat/glint drives the false-alarm noise). The prior lift there comes from biome/location, which is coupled to the scar mechanism — so the 0.868 burn-scar headline is somewhat optimistic, and the season-neutral numbers are the ones to trust.
The core gain is not a prior at all. Detection features alone reach AUC 0.731 on the season-neutral truth — more than double the deployed classifier’s distance from chance. The physical detection signal does separate real fires; the production classifier simply isn’t using it.
Deployment — hidden shadow, verified end-to-end
Promoted the PHOENIX way: as a shadow that scores every candidate alongside the production classifier into a separate, hidden store, logging a live head-to-head each run so the promotion gate can watch whether the lift holds before anything is ever flipped to drive the map. End-to-end operational verification: the scheduled job runs through the standard load discipline and yields to mission work under load; all 12,738 scored rows join 1:1 to live events; the mission database is opened read-only and is never written (no shadow table, separate file); the run is idempotent (full rebuild) and reversible (disable the schedule, delete one file — map and mission data unaffected); and no map or API path reads the shadow store. Nothing is user-facing.
Reproducibility detail
Features (15, all detection-time, all non-leaky).Detection-intrinsic (8): representative detector (categorical), below-comparator-floor flag, coverage flag, fire radiative power, brightness temperature, persistence count, detection confidence, physical-match flag. Context / prior (7): land-cover biome, wildland-urban class, wildland-urban built fraction, hour, month, latitude, longitude. Physical values are joined to each event from the raw detection nearest in source + location + time. All confirmation signals — burn scar, SAR change, corroboration count, verification tier, dNBR — are excluded from features (they define the label; using them would be circular).
Label rule. Positive = any of the 72-hour / 14-day / 45-day reconciliation outcomes begins “confirmed.” Negative = any begins “refuted,” OR the event has zero corroborators and was never confirmed. Corroborated-but-unresolved events are excluded. Labelling is done in code from the raw outcome strings (not SQL), because null outcomes silently mislabel under SQL three-valued logic. Result: 6,174 positive / 6,392 negative (49% base rate) of 12,566 labelled candidates; a further ~6,000 corroborated-unresolved excluded.
Model & protocol. Gradient-boosted trees (400 trees, learning rate 0.06, 31 leaves, min-samples-leaf 20, L2 = 1, class-balanced), isotonic-calibrated, 5-fold cross-validation grouped by 0.2° spatial cells (a model is never tested on a location it trained on). Out-of-fold scores compared head-to-head to the two production scores on the identical events. Season-neutral truth = independent polar (VIIRS/MODIS) active-fire corroboration, which overpasses year-round.
Operational discrimination (deployed scores by real outcome). Confirmed (n = 6,180): re-ranker avg 0.833 / production 0.078. Refuted (n = 210): 0.038 / 0.080. Uncorroborated (n = 6,181): 0.149 / 0.064. The production classifier scores confirmed fires and proven false alarms identically; the re-ranker separates them ~20×. (This table is in-sample for the re-ranker — the honest out-of-sample figure is the cross-validated AUC 0.868; the production flatness is genuine, not in-sample.)
Verification & artifacts. 12,738 candidates scored; 100% join to live events; scores written to a separate hidden store (mission data opened read-only, never written); idempotent full rebuild; reversible; no map/API path reads it. A live head-to-head metrics row (re-ranker vs production AUC on both truths) is appended each scheduled run so the promotion gate can watch the out-of-sample lift before any surfacing decision.
Claim status. Measured retrospective finding on a proxy truth, plus a reversible shadow deployment verified operationally. Not yet field-validated.
Current-literature verdict: AGREES. That a single-frame classifier trades recall for precision and separates active fire from thermal false alarms poorly — while multi-sensor corroboration carries recall — is well established. That a properly retrained, calibrated model recovers usable discrimination is the expected result.
Where we are stricter. We refuse to trust the headline gain without a de-confounding truth, and we hold the corroborated “confirmed” label sacred — the re-ranker runs as a shadow, not blended into the confirmed set.
What this does NOT claim. It does not claim a deployable precision at a chosen operating point (the season-neutral truth is too sparse — 117 events, low precision-recall AUC — to fix that, and the burn-scar operating points are biome-optimistic). It does not claim the production classifier is useless at its extreme top (its top-200 is still 98.8% confirmed) — only that its broad ranking is at chance. It does not claim the shadow improves field outcomes; that awaits live grading. The operational-discrimination table (0.833 vs 0.038) is in-sample for the re-ranker; the honest out-of-sample number is the cross-validated 0.868.
Next test. Watch the logged live head-to-head over the coming weeks as new events reconcile; if the out-of-sample lift and precision hold, consider flipping the re-ranker to re-rank surfacing. Separately, the deeper lever remains retraining the detectors themselves on raw imagery, not a re-ranker over existing candidates.
entry 0113
Root cause: why Sicily’s fires actually start
Separating criminal, negligent, and natural ignition with province- and comune-level evidence — because each one calls for a different response, and treating them as one problem has cost us the ability to fix any of them.
The official “~70% deliberate” number doesn’t survive contact with the data — a province-by-province reassessment of why Sicilian wildfires actually start
Date: 2026-07-24 Status: independent quantitative reassessment (NASA FIRMS 2003–2026, 391 comuni, 9 provinces) cross-checked against a direct read of 3 provincial operational wildfire plans and public reporting on Italy’s fire-cadastre compliance — related to the cross-hazard negative finding in [0089]. Not peer-reviewed — an independent analysis grounded in the publicly available data cited throughout, not a claim of academic or forensic authority.
What this is not claiming: this is not an argument that arsonists, negligent burners, or deliberate ignitions don’t exist — some fires are exactly that. The argument is the opposite: each fire should be assessed and recorded as what it actually is — deliberate, negligent, or natural — instead of a single administrative default. Collapsing all three into “criminal” makes it easy to stop looking for the real, fixable cause once a case is booked as arson; it is the accurate split, not a blanket excuse, that lets each category get the mitigation that actually works on it.
🇮🇹 In italiano — sintesi. La statistica ufficiale siciliana (~70% degli incendi boschivi “di natura dolosa”) non regge al confronto con i dati satellitari indipendenti. Abbiamo analizzato 23 anni di rilevamenti NASA FIRMS su tutta la Sicilia (391 comuni, 9 province), riducendoli a eventi discreti d’incendio, e cercato la firma statistica che distingue un’origine umana casuale/agricola da un’origine dolosa vera. Il risultato: quasi tutti gli incendi siciliani hanno un’origine umana (fulmini <0,4%) — questo è misurabile ed è vero. Ma “umano” non equivale a “doloso/criminale”: quest’ultima etichetta è un codice amministrativo, non una misurazione forense, e nessuno dei tre piani operativi provinciali antincendio (POP AIB 2024) che abbiamo consultato direttamente contiene una tabella di causa per singolo incendio, comune o data. Il Catasto Incendi — l’unico strumento di legge che potrebbe produrre un dato verificabile per singolo evento — risulta, secondo la stampa, in gran parte inutilizzato dai comuni siciliani. La distinzione conta perché criminalità, negligenza e cause naturali richiedono risposte completamente diverse — polizia giudiziaria nel primo caso, applicazione dei regolamenti agricoli e prevenzione nel secondo, gestione del combustibile forestale nel terzo — e continuare a trattarli come un problema unico ci ha impedito finora di affrontare correttamente qualcuno dei tre. La prosa tecnica dettagliata, le tabelle complete e le figure seguono in inglese qui sotto, e sono identiche a quelle pubblicate sul sito.
The analogy. Imagine a hospital that classifies every death as either “murder” or “other,” with no autopsy, no forensic pathologist, and no way for an outside auditor to check a single case file — and then reports that 70% of deaths are murder. You would not treat that number as a measurement of the murder rate. You would ask who is filling out the form, what happens to an uncertain case, and whether the category itself means what it says. That is, functionally, the situation with Sicilian wildfire cause statistics, and this entry is the audit.
BLUF. We built an independent, remote-sensing-only re-analysis of Sicilian wildfire ignition patterns — 23 years of NASA FIRMS active-fire detections (2003–2026), reduced to 41,944 discrete fire events across all 9 provinces and 391 comuni, after removing 436 events (680 raw detections) that turned out to be industrial heat sources, not fire (detailed in the next entry). We tested the one thing remote sensing can measure — whether ignitions carry a human behavioral signature (weekday clustering, calendar concentration around the agricultural burning season, daytime bias, road/farmland proximity) or a natural one (weekday-flat, weather-triggered, forest-interior) — and found overwhelmingly human, agro-pastoral-calendar-linked signatures almost everywhere, with province-specific exceptions that are themselves informative (see 0115 and 0116). We then went looking for the official cause data this independent measurement could be checked against, at any granularity, in any of the three provincial plans we pulled directly. There isn’t any. That gap — not a disagreement with the official number, but the absence of anything to check it against — is the central finding of this thread.
Why this distinction is not academic
“Why did this fire start” is not one question with one answer — it is at least three questions that happen to share a fire:
Was it criminal? A person deliberately set vegetation alight with intent to burn land that wasn’t theirs to burn. This calls for investigation, prosecution, and deterrence — the domain of the Carabinieri and the courts, and nothing PHOENIX, a satellite, or a data pipeline can substitute for.
Was it negligent or customary? A farmer burned stubble on a windy day, a controlled agricultural or pastoral burn escaped its firebreak, a discarded cigarette or a spark from farm machinery caught dry roadside grass. This calls for burn-timing enforcement, permitting, weather-gated bans, and extension education — a regulatory and agricultural-outreach problem, not a policing one.
Was it natural? Lightning strikes dry fuel. This calls for forest fuel management and, where it happens at all in Sicily, is vanishingly rare in our data (see below) — but it is the one cause the official “dolose vs colpose” binary doesn’t even have a box for at meaningful scale.
A regional fire service that reports “70% deliberate” without a case-by-case forensic basis is not being dishonest so much as it is collapsing three different problems into one administrative number — and every year that number goes unchallenged is a year of prevention resources aimed, on the official telling, overwhelmingly at deterring arsonists, when the measurable evidence points overwhelmingly at a farming and land-management calendar instead. If the true mix is mostly negligence and escaped agricultural burning, then more Carabinieri patrols move the needle very little; burn-timing enforcement, firebreak requirements around the harvest and stubble season, and roadside vegetation clearance move it a great deal. Getting the diagnosis wrong doesn’t just misdescribe the problem — it misallocates the response.
What “human-caused” actually means, and why the confusion matters
Almost every account of Sicilian wildfire causation — official and informal — slides between two claims that sound similar but are not:
“Human-ignited” (essentially true, and nearly uninformative on its own). Natural ignition (lightning) accounts for well under 0.5% of detections in our data, consistent with published European wildfire literature for the Mediterranean basin. A vegetation fire in Sicily is, in the overwhelming majority of cases, started by a person — deliberately, accidentally, or as a byproduct of a legal agricultural practice that got away from someone. This part of the official framing is not wrong.
“Deliberate / criminal” (an administrative code, not a forensic measurement, in most of the record we could check). Whether that person intended arson, was negligent, or was doing something entirely legal that the wind turned against them requires scene evidence — witness statements, ignition-point forensics, motive, means — that no satellite, weather record, or land-cover layer can supply. Nothing in our data, or in any dataset built from orbit, can distinguish “a farmer's stubble fire escaped its firebreak” from “a person deliberately set that same field alight” at the ignition point alone. Both leave an identical thermal signature.
Collapsing the two claims into a single number is where the public understanding goes wrong, and it is not solely a Sicilian problem — the pattern recurs in Sardinia, Galicia, and Corsica, each of which reports a high “intentional” share alongside an equally high “no identified motive/culprit” share for the same events, which is a strong indication that “deliberate” is functioning as an administrative default rather than a finding (see references). What we can responsibly say from independent, checkable measurement is: almost all Sicilian fires are started by people, directly or indirectly, and the record currently available does not support a specific breakdown of how many of those were criminal versus negligent versus incidental to a legal practice — because that record, where it should exist, mostly doesn’t.
Figure 1. Every province shows the same qualitative signature — ignitions cluster on weekends (above the 28.6% no-effect line) and inside the harvest/stubble calendar window — consistent with agro-pastoral and land-management activity, not a weekday-flat natural process. Ragusa is the partial exception (see 0115).
The official-record check
We didn’t infer the absence of case-level cause data — we checked for it directly. We pulled and read the Piano Operativo Provinciale Antincendio Boschivo 2024 (POP AIB 2024) for three provinces — Agrigento, Catania, and Palermo — the annual operational wildfire plans published by the Regione Siciliana. None of the three contains a per-fire, per-comune, or per-date cause table anywhere in the document; all three are structurally near-identical operational/logistics plans (resource staging, aircraft basing, command structure) with no retrospective causation analysis at all.
The one legal mechanism that could in principle produce a per-fire, per-parcel cause-relevant record is Italy’s Catasto Incendi (fire cadastre, Law 353/2000), which requires comuni to register burned-parcel perimeters — restricting hunting, grazing, building permits, and land-use change on burned land for years afterward. Per contemporaneous regional reporting (Fenice Verde, July 2026), only a handful of Sicilian comuni had used the current digital cadastre system to update their registries months after the legal deadline, and comuni delinquent from as far back as 2022 were only formally commissioned into compliance in May 2024. The one instrument that could turn “cause” into a checkable, per-fire record is not, on the evidence available, being kept.
We take no position on whether the true deliberate share is higher or lower than 70% — that would require exactly the case-by-case forensic work this entry argues is missing. What we can say with confidence is that the number as currently reported cannot be independently verified by anyone outside the agency that issues it, for a single fire, in any of the provinces we checked.
Claim status: SUPPORTED (human-ignition dominance, weekday/calendar signature) and CORROBORATED-GAP (absence of checkable official per-fire cause record, confirmed by direct document review, not inference).
Current literature & PHOENIX alignment. Verdict: AGREEMENT with the broader Mediterranean literature that “intentional” fire-cause statistics in the region function as an administrative residual category rather than a forensic measurement (see Sardinia, Galicia, Corsica comparators in references). Our contribution is a Sicily-specific, comune-level quantitative test of the same pattern, plus a direct document check rather than a general claim about the region.
What the external literature reinforces: that natural (lightning) ignition is a small minority share in Mediterranean Europe generally, and that “deliberate” shares elsewhere correlate more with missing-motive/no-suspect administrative categories than with confirmed criminal investigations.
Where PHOENIX is stricter: we do not assert a corrected deliberate-arson percentage of our own — remote sensing cannot supply intent, and we say so explicitly rather than substituting one unverifiable number for another.
What this entry does not claim: it does not claim any specific fire was or was not arson; it does not claim the official 70% figure is fabricated (it may be a good-faith administrative default under investigative uncertainty); it does not claim natural ignition is a meaningful contributor (it measurably is not, at <0.5%).
Next research test: the province- and comune-level breakdown, the industrial/fumarole corrections, and the non-attributable anomaly candidates that this reassessment surfaced are in 0115 and 0116.
Public data sources: NASA FIRMS MODIS/VIIRS active-fire archive (public API); Regione Siciliana POP AIB 2024 provincial plans (public PDF); OpenStreetMap/Overpass (ODbL); Open-Meteo ERA5 historical archive (public API).
entry 0114
Nine provinces, 391 comuni: what changed when we broke it down — and the industrial contamination and illegal waste-burning we had to correct for before trusting any of it
Date: 2026-07-24 Status: province- and comune-level quantitative breakdown, with two applied data-quality corrections and one independently corroborated finding — continues 0114
🇮🇹 In italiano — sintesi. Scendendo al livello di provincia e comune sono emerse due correzioni necessarie e una scoperta. Prima correzione: 35 celle geografiche (~680 rilevamenti, ~436 eventi) risultavano fonti di calore industriali (raffinerie, centrali elettriche) scambiate per incendi — rimosse con una verifica fisica diretta (potenza radiativa, frazione notturna), non solo con il flag “type” di FIRMS che le cattura solo in parte. Seconda correzione: ogni provincia mostra un aumento apparente degli incendi rilevati nel tempo, ma la tendenza scompare in tutte le 9 province se ci si limita alla serie coerente MODIS — l’aumento è quasi certamente un artefatto della maggiore risoluzione VIIRS, non più incendi reali. La scoperta: i due comuni di Ragusa con più eventi rilevati, Acate e Vittoria, mostrano un pattern statisticamente diverso da tutto il resto della Sicilia (nessun effetto weekend, altissima frazione notturna) — e una verifica giornalistica indipendente conferma che i Carabinieri conducono operazioni ripetute contro le “fumarole”, la combustione notturna illegale di rifiuti plastici delle serre, esattamente in quei due comuni, con denunce nel luglio 2026. Le statistiche antincendio della provincia di Ragusa stanno probabilmente misurando in parte un reato ambientale diverso, non incendi boschivi.
Correction 1 — industrial heat sources misread as vegetation fire
A repeat-ignition-location scan (the same technique used to flag a fixed recurring source; full method in 0116) surfaced several grid cells recurring far above their local background. Checking them individually mattered: they land almost exactly on Sicily’s largest energy infrastructure — the Priolo Gargallo/Melilli/Augusta petrochemical corridor (Siracusa), the Gela refinery, the Milazzo refinery corridor near San Filippo del Mela, and Porto Empedocle. Their physical signature is unambiguous: median fire radiative power under 3 MW per location (versus a 5.9–8.2 MW province-wide wildfire median), ≥85% nighttime detections, recurring at the same ~350m spot across 4 or more separate years — a gas-flare/industrial-heat signature, not wildfire. FIRMS’ own confidence-classification flag catches some but not all of this contamination inconsistently across sites, so we filtered on the physical signature directly. 35 cells, roughly 680 raw detections and 436 discrete events, were removed before any province- or comune-level statistic in this thread was computed.
Figure 2. The 35 corrected cells sit an order of magnitude below the wildfire FRP baseline — a physical, not administrative, basis for exclusion.
Correction 2 — the sensor-bias trap in the “rising fires” trend
Every one of the 9 provinces shows a statistically significant rise in pooled (MODIS+VIIRS) event counts from 2003 to 2025 (p<0.05 in 8 of 9). That trend disappears in all 9 provinces once restricted to the MODIS-only consistent sub-series — VIIRS came online mid-record with roughly 3× finer spatial resolution and mechanically detects more small fires without any actual increase in ignition activity. Reporting the pooled trend as evidence of “more fires” would be a sensor-capability artifact mistaken for a behavioral finding — exactly the kind of error this thread is built to avoid making, in either direction.
Figure 3. Red bars (pooled trend) cross the significance line in several provinces; the same provinces' green bars (MODIS-only) do not, in any of the 9.
The discovery — Ragusa is measuring a different phenomenon
Acate and Vittoria are, by a wide margin, the two highest-event-count locations in Ragusa province — 798 and 571 discrete events respectively over the study period, both showing a signature unlike anywhere else in Sicily: essentially flat by day of week (no statistically significant weekend elevation — the one clear population-level exception on the entire island), and extreme concentration in nighttime detections (41–46% versus a Sicily-wide average near 18%). A live check for this report found the explanation: Carabinieri in Ragusa province have run repeated 2026 operations against “fumarole” — illegal nighttime burning of plastic and greenhouse waste from the area’s intensive horticulture industry (the “fascia trasformata” greenhouse belt) — with a helicopter-supported sweep in the two weeks before this report seizing 4 illegal disposal sites and referring 7 people to the Ragusa Prosecutor’s Office, including prosecutions specifically in Acate and Vittoria. Ragusa’s fire-event statistics are very likely measuring, in significant part, an illegal-waste-disposal crime wave, not vegetation wildfire — which is also the most parsimonious explanation for why Ragusa is the one province where the population-level weekday signature fails to reach significance province-wide (p=0.83).
Figure 4. The Sicily-wide pattern (blue) rises toward the weekend everywhere else; Acate and Vittoria (red/orange) show no such structure — consistent with an industrial/commercial waste-burning schedule rather than weekend agricultural activity.
Province-level summary
Province
Events
Weekend share
Harvest+stubble share
Night fraction
Closer to farm than wood
Reading
Agrigento
8,084
32.1%
46.6%
17.5%
70.7%
textbook agro-pastoral pattern
Caltanissetta
6,300
30.7%
34.8%
11.7%
57.2%
agro-pastoral, less calendar-concentrated
Catania
5,958
30.0%
48.4%
17.6%
57.5%
agro-pastoral; one unresolved industrial-zone cluster (0116)
Enna
2,579
29.6%
36.8%
15.5%
51.5%
agro-pastoral, mixed farm/wood interior
Messina
2,595
33.0%
35.4%
26.7%
39.5%
most forested province — wood-proximate, still weekend-skewed
Palermo
6,254
30.2%
25.3%
14.6%
61.9%
agro-pastoral, broader calendar spread
Ragusa
2,283
29.4%
40.2%
40.2%
73.8%
fumarole-contaminated — not a clean wildfire signal (see above)
Siracusa
2,406
27.9%
48.0%
17.6%
54.6%
agro-pastoral, post-correction for petrochemical-corridor contamination
Trapani
5,485
32.3%
43.9%
15.8%
62.2%
textbook agro-pastoral pattern
All figures post-correction (industrial static sources removed). “Harvest+stubble share” = share of events falling in the 15 Jun–15 Aug calendar window. Municipality-level breakdowns for all 391 comuni, gated at n≥30 events for any inferential statistic, are in the underlying dataset linked below.
Claim status: SUPPORTED (both corrections, physically verified) and CORROBORATED (Ragusa fumarole finding, cross-checked against independent contemporaneous news reporting, not asserted from the satellite data alone).
Current literature & PHOENIX alignment. Verdict: AGREEMENT that active-fire satellite products require industrial/flare-source screening in petrochemical regions (a documented FIRMS limitation); AGREEMENT that VIIRS-era resolution gain inflates naive fire-count trends versus MODIS-only baselines, consistent with the broader remote-sensing literature on multi-sensor fire-count series discontinuities.
Where PHOENIX is stricter: we did not rely on FIRMS’ own type/confidence flag alone to exclude industrial contamination — it under-catches several confirmed sites — and we did not assert the Ragusa fumarole explanation from the satellite signature alone; we required independent, dated, named corroboration before publishing it as a finding rather than a hypothesis.
What this entry does not claim: it does not claim every Ragusa event is fumarole-related (genuine wildfire almost certainly still occurs there too); it does not claim the 35 corrected cells are the only contamination in the dataset, only the ones that cleared a conservative physical threshold; it does not claim province rankings are stable to a different clustering or grid-cell choice — sensitivity to method is a documented, open limitation.
Next research test: the remaining, non-attributable anomaly candidates — locations and dates that fit none of the explanations above — and what response each category of finding actually calls for, are in 0116.
Public data sources: NASA FIRMS (MODIS/VIIRS); OpenStreetMap/Overpass (roads, settlements, landuse, admin boundaries); Open-Meteo ERA5 archive (precipitation proxy).
entry 0115
Where the ordinary explanations run out — non-attributable anomaly candidates, and what to actually do about each category, by province
Date: 2026-07-24 Status: exploratory anomaly detection with an honest walk-back, plus a practical response framework by finding-category and province — concludes the thread begun in 0114
🇮🇹 In italiano — sintesi. Dopo aver escluso tutto ciò che le due voci precedenti già spiegano — contaminazione industriale, il pattern “fumarole” di Ragusa, e l’ordinaria attività agro-pastorale — cosa resta che assomigli più a un incendio doloso isolato che a una di queste categorie? Due segnali distinti. Primo: la ricorrenza nello stesso punto esatto — quasi completamente risolta (19 celle su 20 ora hanno una spiegazione nota); l’unica rimasta (Salaparuta, Trapani) non regge a un esame manuale più attento e viene onestamente ritirata come candidato. Secondo: 54 incendi significativi che soddisfano simultaneamente cinque criteri — innesco notturno, accessibilità stradale, lontananza sia da terreni agricoli sia da insediamenti, fuori dal calendario di mietitura/stoppie, e in un comune con un pattern settimanale normale ben consolidato che quell’evento specifico non segue. Nessuno di questi è una prova; ognuno è un luogo e una data dove le spiegazioni ordinarie si esauriscono insieme, e che meriterebbe un riscontro con permessi, pattugliamenti o testimonianze. Nessun individuo è identificato in nessun punto di questo rapporto. La sezione finale propone risposte pratiche diverse per ciascuna categoria — perché criminalità, negligenza e un reato ambientale come le fumarole non si affrontano con lo stesso strumento.
Two different signals, kept separate
Repeat-location recurrence. We gridded Sicily at ~500m and counted distinct fire events (not raw detections) per cell across the full 23-year record, flagging cells whose own count ran far above their local 5×5-cell neighborhood background — the same logic fire investigators use to flag a fixed recurring ignition source. Of the 20 cells that cleared this bar, 19 now trace to a named, checkable explanation: 12 to the industrial corridors in 0115, 7 to the Acate/Vittoria fumarole zone. The single remaining cell, near Salaparuta (Trapani), 6 fires 2007–2019, does not survive a manual read of its own raw dossier: farmland sits only 0.6–1.1km away, 3 of its 7 fires are weekend, and its largest fire there (235.9 MW, 3 September 2016) is a Saturday-afternoon ignition — squarely inside the population pattern, not outside it. Applied honestly, the repeat-location method does not leave a standing “someone keeps lighting this exact spot” candidate anywhere on the island once the confirmed explanations are removed. We are reporting that null result because a method that only ever finds what it’s looking for isn’t worth trusting when it does.
Individually anomalous significant fires. A different, stricter test: single fires (not trivial single-pixel detections — n≥3 detections or FRP≥20 MW) that are simultaneously night-ignited, road-accessible, far from any farmland edge and any settlement (so not explained by crop-residue or yard/trash burning), outside the harvest/stubble calendar, and located in a comune with an otherwise well-established, clearly weekend-skewed normal pattern that this specific fire breaks. All five conditions had to hold together — a conjunctive filter, not an additive score — which is why, after excluding a buffer around every confirmed industrial and fumarole zone, only 54 of tens of thousands of events qualify. None of these are proof of anything. Each is a location and a date where the ordinary explanations run out at the same time, in a way that would be worth checking against permit, patrol, or witness records — not a conclusion, an investigative lead.
Figure 5. The 54 candidates cluster in western/central Sicily — partly reflecting where enough comuni clear the statistical baseline needed to test against (Agrigento and Palermo have the most qualifying comuni), not necessarily where anomalies are most common.
The 15 highest-magnitude candidates (location and date only — non-attributable)
What the independent classification looks like, island-wide
Figure 6. A random, stratified 72-event sample (8 per province), run through a transparent covariate-only classifier. This is a plausible-activity classification, never an intent determination — the same limitation discussed throughout this thread.
Resolutions — because the four categories need four different responses
This is the point of the whole exercise. A single “anti-wildfire” budget line cannot serve criminal deterrence, agricultural regulation, environmental-crime enforcement, and forest management equally well, because they are not the same problem:
Finding category
Measured share (approx.)
What actually addresses it
Where it concentrates
Agro-pastoral debris-burning escape
largest single category, all provinces
Weather-gated burn-timing enforcement around the harvest/stubble window (15 Jun–15 Aug); mandatory firebreaks around agricultural burns; extension education tied to permit issuance, not after-the-fact fines
Agrigento, Trapani, Caltanissetta interior — the clearest textbook pattern
Other human-caused, non-agro (roadside)
second-largest category
Roadside vegetation clearance along high-traffic rural routes ahead of dry season; driver-facing fire-risk signage during red-flag days; this is an infrastructure/maintenance budget line, not a policing one in most cases
distributed, road-network-driven rather than province-specific
Illegal agricultural-waste burning (“fumarole”)
dominant in 2 comuni, Ragusa
This is not a wildfire-suppression problem — it is a waste-management and environmental-crime enforcement problem. The response already underway (Carabinieri helicopter surveillance, site seizure, prosecution) is the correct tool; the complementary lever is subsidized/accessible legal disposal for greenhouse plastic waste, which is the actual driver of the incentive to burn it illegally at night
Acate, Vittoria (Ragusa) specifically
Genuinely unexplained anomalies
54 candidate events, 1 walked-back hotspot
Targeted, location-specific investigator follow-up (permit records, patrol logs, witness canvassing) — not a regional policy response. A blanket “crack down on arson” posture applied island-wide, based on this evidence, would spend resources on the 76%+ of events that look agro-pastoral or roadside while barely touching the <0.2% that look genuinely anomalous
see the 54-row list above; concentrated in Agrigento and Palermo partly because those provinces have the most comuni large enough to test against
The measurement gap itself
island-wide, all 3 provinces checked
Actually enforce Catasto Incendi compliance so a per-fire, per-parcel cause record exists to check any future claim against — the cheapest, highest-leverage fix on this entire list, because every other response above depends on knowing the true mix, and right now nobody outside the issuing agency can check it
all 9 provinces
None of this requires accepting or rejecting the official 70% figure. It requires treating “why did this fire start” as the multi-part question it actually is, funding the parts separately, and building the one piece of infrastructure — an actually-maintained per-fire cause record — that would let anyone, including the agency itself, tell next year whether the response is working.
Claim status: EXPLORATORY (anomaly candidates, both signal types) with one documented negative result (the walked-back Salaparuta hotspot) and a practical, non-quantitative recommendation set (resolutions table).
Current literature & PHOENIX alignment. Verdict: AGREEMENT that repeat-ignition-point analysis is a standard, legitimate fire-investigation technique for flagging recurring sources, and that it requires case-by-case verification rather than automated trust — which is exactly why we walked one candidate back after a manual check rather than reporting the automated output as-is.
Where PHOENIX is stricter: the conjunctive (all-conditions-must-hold) filter for individual anomalies was deliberately chosen over an additive score after an earlier, looser version returned 768 candidates — a result we judged uninformative and discarded rather than reported, on the same principle as the walked-back hotspot: a method that flags too much is exactly as unhelpful as one that flags nothing.
What this entry does not claim: it does not identify, name, or implicate any individual anywhere in this analysis — every flag is a location and a date, never a person; it does not claim the 54 candidates are arson (each could still have an explanation this method can’t see — an unmapped legal activity, a data artifact, a genuinely unlucky escaped fire); it does not claim the resolutions table is exhaustive or that its category shares are precise percentages rather than approximate, order-of-magnitude readings from the sample.
Next research test: ground-truth verification of the unresolved Catania industrial-zone cluster (see 0115); direct outreach to any comune willing to share Catasto Incendi records for a genuine per-fire validation study, which would be the first such check attempted for this region.
Public data sources: derived entirely from the datasets cited in 0114 and 0115; full anomaly candidate list and code in the repository.
entry 0116
Our newer detector generalises worse than the one it replaced
Date: 2026-09-06 Status: NEGATIVE (published against our own interest; see the standing rule on reporting limits with wins)
The analogy. A student who is coached on last year's exam paper will score better on last year's exam paper. Whether they have learned the subject is a different question, and you only find out by handing them a paper from another school.
BLUF. PHOENIX ground-sensor model v20 was trained on mined hard negatives, specifically to cut false positives. Evaluated on a public benchmark it has never seen, it is worse than the v15 model it replaced — and the metric it loses is precision, which is the exact thing hard-negative mining is for.
The measurement. Both models were run against the PyroNear2025 validation split (pyronear/pyro-sdis): 4,099 images, 3,942 annotated smoke instances, 754 background frames, evaluated at 1024 px, IoU 0.6, confidence floor 0.001. Neither model has seen any of it — different country, different vegetation, different cameras.
Model, on PyroNear2025 val
Precision
Recall
F1
AP50
AP50-95
v15 self-distilled
0.737
0.763
0.750
0.784
0.525
v20 hard-negative
0.713
0.769
0.740
0.770
0.513
What it means. v20 buys 0.006 of recall and gives back 0.024 of precision. On our own Sicilian ground truth v20 is the better model, which is why it was promoted. Off it, the trade inverts. The straightforward reading is that the hard negatives it learned are Sicilian hard negatives — our quarries, our polytunnels, our particular afternoon haze — and that knowledge does not travel. The gain is real. It is also local, and we had not measured how local until now.
Why this is published. Our in-domain figure is 98.0% recall on-chip. Quoted alone it invites a reader to assume the model is that good everywhere, and it is not. The honest pair is 98.0% at home and roughly 0.75 F1 away from home, with the gap stated rather than left to be discovered by whoever evaluates us next.
Method note — two silent failures worth naming. This measurement returned all zeros twice before it returned anything true, and neither failure looked like a bug. First, the class index disagreed in three places at once: the dataset labels smoke as class 1, our models emit class 0, and the dataset YAML declared only one name. Second, after that was fixed, ultralytics reused a labels/val.cache built before the remap, so the corrected labels were never read. Both produce a clean run reporting 0.000 across the board, which reads as a worthless model rather than a broken harness. The evaluation script now asserts the label class space matches the model before spending any GPU time, and deletes the cache on every run.
Current literature & PHOENIX alignment. Cross-dataset degradation in wildfire smoke detection is well documented, and the direction here agrees with it: lightweight detectors that score highly in-domain commonly fall to the 0.6–0.8 F1 band on unseen deployments. Where this entry adds something is the within-project comparison — the literature generally reports one model against several datasets, whereas the interesting result here is two generations of the same model against one unseen dataset, showing that an improvement validated in-domain can be a regression out of it. What this post does not claim: that v20 is the worse model overall, that v15 should be redeployed, or that hard-negative mining is unsound. It claims only that the benefit measured in Sicily was not transferable, and that we did not know that until we looked. The next test is whether negatives mined from a second geography restore the precision, which would confirm the locality explanation rather than a capacity one.
How PHOENIX scored itself against other feeds, and why most of those scores did not measure anything
Date: 2026-09-17 Status: CORRECTION and NEGATIVE (published against our own interest). Supersedes the lead-time figures in 0017.
The analogy. A referee who decides a match by checking whether anyone complained afterwards will call most games fair and a few of them fouls, and neither call says much about the game. Our scoring worked like that. It looked for any sign that a fire had happened nearby, at any time, and counted silence as a false alarm.
BLUF. An adversarial audit of every place PHOENIX compares itself with other fire feeds found that the headline numbers were artefacts of the scoring, not measurements of the detector. Alert precision of 43%, detector precision of 100% (199 of 199), and "PHOENIX first in 90% of races" all fall apart. The comparison that holds up, measured against a decoy null, is narrower: PHOENIX's own detectors see a real share of the fires the polar satellites see, above chance, and are first by half an hour or more on a minority of them.
What was wrong with the truth. Two sources did most of the confirming. The burn-scar check had no time bound. All 931 stored burn verifications came from a single Sentinel-2 scene of 26 May 2026, and 229 alerts from August and September were "confirmed" by it; one dNBR value alone confirmed 689 events. The fire-brigade feed was not a list of fires either. Its 2,593 rows were 15 national news items pinned to 14 fixed points, among them a beach-volleyball championship and a storm in Friuli, because the matcher treated the phrase vigili del fuoco as a fire keyword. Against that, anything without corroboration was scored a false positive. Nothing had actually been refuted: all 338 "false positives" in the alert ledger meant only that nothing had confirmed them.
What was wrong with the counting. One fire was counted once per cluster fragment, so 923 alert rows were 192 fires. The race table computed a race only when PHOENIX was the first row of an event, which means races PHOENIX lost never entered it, and events held rows from a 30-minute window, so no lead could exceed 30 minutes. 554 of the "wins" came from a detector that lowers its thresholds where FIRMS has already reported a fire. 75 more came from FIRMS data written back into PHOENIX's own table. The detector precision on the transparency endpoint counted a satellite tier as a confirmation, including tiers whose outcome had been refuted.
What holds up. For each comparator we clustered its detections into episodes (5 km, 6 h) and asked whether PHOENIX's independent detectors fired within 5 km in the surrounding window. Then we asked the same question at a decoy point 10–30 km away, on burnable land, with no independent thermal detection nearby. Window: 18 July to 15 September 2026.
Comparator
Episodes
PHOENIX saw it
Same test at decoy
PHOENIX first by ≥30 min
At decoy
VIIRS (FIRMS)
1,801
33.1%
20.8%
17.4%
9.6%
MODIS (FIRMS)
327
52.6%
16.2%
35.8%
9.2%
SLSTR
222
35.1%
8.6%
31.1%
7.2%
MTG FCI active fire (EUMETSAT)
276
68.8%
23.2%
22.8%
13.0%
How to read it. Only the gap between the paired columns is evidence. Against VIIRS the excess is 12 points of detection (paired exact test p ≈ 2×10⁻²⁰) and 8 points of meaningful lead. Roughly half of the raw "PHOENIX was first" cases would have happened at a random point, because PHOENIX's raw stream fires somewhere near most places on most days. Against EUMETSAT's own FCI fire product, built from the same instrument, the median PHOENIX detection comes 7 minutes later. PHOENIX adds real signal. It is not a faster version of the operational products, and it misses most of the fires the polar satellites see.
What changed. The truth layer now accepts only time-bounded, independent evidence: human-reviewed ground reports (3 km, 24 h), high-resolution thermal hits (1 km, 12 h), fire-brigade rows that name a vegetation fire and a Sicilian place in the headline, and a Sentinel-2 check that brackets the fire with the nearest clear scenes. What counts as a Sentinel-2 burn is being calibrated against the decoys rather than assumed, and until that finishes Sentinel-2 decides nothing. No evidence now means unconfirmed or unverifiable, never refuted. Alerts are scored as fires, not fragments, and precision is reported as a range. The race is the decoy-paired measurement above. The public map no longer weights markers by precision figures nobody measured, and the accuracy page no longer shows estimates.
What this leaves open. Alert precision is not determinable today. Of 106 alerted fires old enough to score, none is yet confirmed or refuted under the new rules; 13 were checked without a clear answer and 93 have no valid check. That is the honest state, and it will move as the Sentinel-2 calibration completes. The earlier "more sensors, more false positives" pattern was built on the broken truth and should not be cited.
Correction to 0017. The "+129 min, 72% PHOENIX-first against VIIRS" delivery lead measured the FIRMS near-real-time publishing delay, not PHOENIX. The FCI candidate is stamped within seconds of imaging, so the difference is FIRMS latency by construction. A validation run on 16 June 2026 showed this, and 0017 should have been corrected then. On the sensing clock the same pairs gave a median of −5.9 minutes with an interval crossing zero.
Addendum, 18 September 2026: the Sentinel-2 check is calibrated. Against 111 known-real fires and 412 decoys, one feature separates them: the 90th-percentile dNBR within 500 m minus the median of the 1–2 km ring around it. At 0.071 or more the check calls a burn. It finds the scar on 95.5% of the known-real fires (89.9–98.1%). On decoys — matched points 10 to 30 km away, same day, same land cover, no independent thermal detection nearby — it calls a burn 8.0% of the time (5.8–11.0%). That 8% is the number to hold on to. Everything below is a measurement against it.
A correction, hours old. An earlier version of this addendum, published this morning, put that false-burn rate at 5.6%. It came from a single 50/50 split, and the split was doing more damage than it looked. Of 111 fires it put 41 in the test half; of 412 decoys, 197. Everything else was spent on choosing the threshold and then thrown away. So we replaced it with grouped five-fold cross-validation: each fold picks its own rule on the other four and is scored on the fold it never saw, and the folds are pooled. Every sample gets scored exactly once, while it is out of sample. The rate went from 5.6% to 8.0%, and the interval got tighter rather than wider — which is the signature of the first number being lucky rather than merely noisy. The folds agree with the shipped rule on 96.6% of the calls they make, so this is one rule being measured honestly, not five different rules averaged into a number that describes none of them.
What the check says about the alerts. Corrected for the check's own error rates, counting only alerts a calibrated check examined. The operator alerts built from multi-sensor FIRMS clusters were real fires 79% of the time (78 burns in 101 checks; range 66–93%). PHOENIX's own detectors were not. From the independent ones alone: 12 burns in 182 checks, 6.6% raw against the 8.0% a random point produces — below the noise floor, correcting to 0% with an upper bound of 6.4%. On this evidence the independent detectors are not distinguishable from picking a point on the map. The FIRMS-primed detector does carry signal — 17 burns in 71 checks, about 18% (5–35%) — which is what you would expect of a detector that only fires where FIRMS already reported something.
Why there is still no way to say a place did not burn. A refutation rule would let us report precision as confirmed over confirmed-plus-refuted. Without one, nothing can be refuted and that figure reads 100% by construction, so we suppress it. The morning's holdout made the rule look nearly good enough: 2.4% of real fires wrongly called clear, with an upper bound of 12.6% against a 12% ceiling — a quarter of a point short. Cross-validated on all 111 fires it is 7.2% (3.7–13.6%), and the near miss was noise in a 41-fire sample. To clear the ceiling at 7.2% needs roughly 230 known-real fires. We have 111, and that is the whole record: 669 multi-instrument fire clusters since mid-June collapse to about 125 distinct events. The Vigili del Fuoco feed looked like the way out and is not — its rows are geocoded news items, and the most recent one is a cliff rescue in Calabria placed on the north Sicilian coast. So the honest position is that the refutation rule waits for either another fire season or a burn check that sees smaller scars, and we say so rather than shipping a number that cannot fall.
Two things this overturns. The old finding that more sensors meant more false alarms is the wrong way round: 2 sensors about 62% (41–82%), 3 sensors about 92% (73–100%), 4 or more about 95% (70–100%). And the stream worth trusting is the one PHOENIX did not build: the FIRMS clusters. The caveat that remains is sensitivity — the check was measured on fires big enough for four instruments to see, so if it misses small scars the own-detection share is higher than zero. Settling that needs a check that sees small scars, or ground truth from people.
entry 0124
Two algorithms reading one satellite image are one witness: our multi-sensor vote was confirming fires on a single instrument's say-so
Date: 2026-11-01 Status: CORRECTION (published against our own interest) + fix deployed, with two smaller negatives. Follows 0124.
The analogy. Two people reading the same thermometer have not taken two temperatures. If the thermometer sits in the sun, both of them will swear to the same wrong number. Our fire vote counted them as two.
BLUF. PHOENIX promotes a hot spot to its highest tier when two independent detectors agree on it. "Independent" was defined by algorithm, not by instrument. Three of our detectors run on the same MTG-FCI image, so every promotion in a 48-hour audit of the public map (72 of 72) was an agreement among them, and 71 of the 72 had no NASA FIRMS pixel within 5 km and 12 h. A decoy set moved 25–40 km away matched FIRMS more often (2.8% against 1.4%). The vote now needs two different instruments. Replayed over the 14 days to 2 November, that rule keeps 6 of 370 votes. The 364 it removes matched a FIRMS pixel 5.5% of the time, which is what a vote on noise looks like. The detections themselves stay on the map, amber.
What the vote was counting. The 370 votes broke down like this. 216 were a wind-drift detector plus a geostationary detector whose threshold had been lowered near an earlier FIRMS report. 73 were the wind-drift detector plus the FCI subpixel detector. 55 were the two FCI detectors together. Our own satellite validator, which adds a vote when it judges a crop fire-like, scores the same SEVIRI frames, so its "third voter" added no new eyes either. Even two Sicilian news outlets counted as two sensors, and outlets republish each other. Full table in the data file below.
14 days to 2026-11-02
Votes
FIRMS pixel within 5 km / 12 h
All votes, old rule (two algorithm families)
370
20 (5.4%)
Removed by the instrument rule
364
20 (5.5%)
Kept (geostationary IR + a news report)
6
0
The rule. One instrument family per witness. Geostationary infrared is one family on purpose: FCI and SEVIRI fly on different satellites, but they share the failure modes that matter in Sicily — the same refinery flares, the same sun-warmed coastline, the same 3–5 km pixels. Polar VIIRS/MODIS, SLSTR, Sentinel-2, SAR, the fire brigade's incident reports and the news each count once. A source the rule does not recognise counts as its own instrument, so a newly named detector can never quietly suppress a real fire. The public map had already started demoting single-instrument votes on 1 November; the vote itself now agrees with it, so nothing downstream of it can read noise as consensus.
A second defect, in the clock. In high fire danger the vote runs every minute instead of every five. The switch read "the highest fire-weather value in the table", but the table holds all six codes of the Canadian Fire Weather Index system per day, and the Drought Code normally runs into the hundreds by autumn [53]. On 1 November the switch read 997.7 (the Drought Code) when the actual index for Sicily was 19.2, well under its threshold of 30. So the fast cadence had been on all year. Reading only the index itself, it would have been on every recorded day from May to August (peak 103.8, in July), 14 of 27 days in October, and not at all so far in November. That is what it was meant to do.
A negative about our own scorecard. Our outside grader compares the public map with FIRMS and reports a chance baseline beside every recall (see 0124). At 22:30Z on 1 November it said our own detectors caught 56% of FIRMS fire clusters against 41% by chance. At 02:00Z it said 0 of 6 against 22%. Nothing broke in between: our detectors kept producing every hour. The 48-hour window simply rolled onto small fires where the nearest detections of ours are a day older than the satellite pixel, and the grader rightly refuses to credit those. With six clusters, a swing like that is mostly sampling. Read neither number as a trend; read the gap to chance, over weeks.
A blind case we found and did not fix. The SEVIRI subpixel detector compares mid-infrared brightness with the land-surface temperature (LST) of each pixel. When the LST grid arrives but holds no valid pixel at all, as happens on some cloudy nights, no pixel can pass, and that is stricter than having no LST, where a deliberately hard 315 K fallback applies. It happened on 3 of about 830 frames in a week, all on the night of 1 November, and on those frames the hottest pixel was 287 K, so the fallback would have found nothing either. Measured effect: zero. The one-line change waits for a planned restart rather than forcing one.
What we are not doing. FIRMS does take part in the vote, when its pixel arrives inside the vote's 60-minute window: 18 votes between June and October include it. Its near-real-time data usually lands about three hours after the satellite pass, so most FIRMS pixels miss the window. We considered letting late FIRMS pixels join a vote after the fact, and decided against it. A vote that closes hours later on FIRMS's word would be a FIRMS report with our name on it, and our scorecard already counts reposts separately from detection.
Claim status: CORRECTION, SUPPORTED by a 14-day replay with an outcome check the rule never sees. The fire-weather defect is a measured fact (one live reading plus the full table history). The grader swing and the LST blind case are reported negatives, not claims.
Current literature & alignment.Verdict: AGREES. Wooster et al. [52] review satellite active-fire sensing and treat geostationary and polar fire products as complementary because their sampling, resolution and error sources differ; that difference is exactly what an independence rule has to rest on. Miller [53] sets out the Drought Code as a slow, deep-moisture index that accumulates over a season, which is why it cannot stand in for the overall Fire Weather Index.
What the literature reinforces: agreement between products from different platforms carries more information than agreement between algorithms on one platform.
Where PHOENIX is stricter: we fold FCI and SEVIRI into one witness even though they are different satellites, because over Sicily they fail on the same targets.
What this does NOT claim: that the six surviving votes are real fires (none matched FIRMS), that geostationary detections are worthless (they keep their own map pins, and 0124 measured real signal above chance), or that 5.5% is a precision figure for anything.
Next test: score the instrument rule forward, on votes it creates from now on, against FIRMS and fire-brigade reports with the decoy null; and measure how often a second instrument is even available within the vote window, since that bounds how many real fires can ever reach the top tier.
Method note: the rule was written, replayed and deployed by an AI coding agent (Claude) working for the PHOENIX team, and checked by mutation tests and the outcome check above. The replay uses every non-retracted vote in the window; nothing was selected.
entry 0125
References
Primary sources and Consensus links used in the literature-alignment blocks above. Full annotated mapping in the repository (references/LITERATURE_ADDENDUM_v1.md).
Ghali & Akhloufi, 2023, Fire — Deep Learning Approaches for Wildland Fires Using Satellite Remote Sensing Data: Detection, Mapping, and Prediction. link
Zhang et al., 2024, Neurocomputing — 10-minute forest early wildfire detection: fusing multi-type and multi-source information via recursive transformer. link
Wang et al., 2024, Geo-spatial Information Science — FASDD: an open flame and smoke detection dataset for deep learning. link
Dong & Wang, 2025, Remote Sensing — HybriDet: a hybrid CNN+Transformer for wildfire detection. link
Xu et al., 2026, Science of Remote Sensing — Major Improvements in Spaceborne Early Fire Detection and Small-Fire FRP Retrieval with MTG-FCI. link
Paugam et al., 2025 — Fire behaviour monitoring using Meteosat Third Generation (FCI-FireDyn algorithm). link
Paugam et al., 2026 — Leveraging MTG-FCI fire observations for event-based fire behaviour monitoring. link
EUMETSAT — Meteosat Third Generation (FCI + Lightning Imager). link
NASA Earthdata — VIIRS I-Band 375 m Active Fire Data (confidence field definition). link
NASA FIRMS — Fire Information for Resource Management System. link
Dhage, 2025 — Systematic Absence of Low-Confidence Nighttime Fire Detections in the VIIRS Active Fire Product. link
Ouazri et al., 2026 — Machine-learning wildfire occurrence prediction (ERA5/FWI/FIRMS, northern Morocco). link
Han et al., 2026, Forests — A Comparative Review of Wildfire Danger Rating Systems: fuel-moisture modeling frameworks. link
McNorton & Di Giuseppe, 2024, Biogeosciences — A global fuel characteristic model and dataset for wildfire prediction. link
Jakubik et al., 2023 — Prithvi: foundation models for generalist geospatial AI (HLS; wildfire-scar fine-tune). link
Szwarcman et al., 2024, IEEE TGRS — Prithvi-EO-2.0: a versatile multitemporal EO foundation model. link
Shibli, Nascetti & Ban, 2026 — Low-Rank Adaptation of Geospatial Foundation Models for Wildfire Mapping using Sentinel-2. link
Hong et al., 2023, IEEE TPAMI — SpectralGPT: spectral remote-sensing foundation model. link
Liu et al., 2023, IEEE TGRS — RemoteCLIP: a vision-language foundation model for remote sensing. link
Li et al., 2025, IEEE TGRS — FlexiMo: a flexible remote-sensing foundation model (sensor/resolution heterogeneity). link
Torrisi, 2025, Annals of Geophysics — Integrated ML for volcanic cloud tracking: Etna lava fountains 2020-2022. link
Torrisi et al., 2024 — Deep learning + geostationary remote sensing for volcanic-cloud monitoring (ABI/SEVIRI Ash RGB). link
Corradino et al., 2023, IEEE TGRS — Detection of subtle thermal anomalies: deep learning on the ASTER global volcano dataset. link
Copernicus Data Space — Sentinel-5P / TROPOMI documentation (SO2, aerosol index). link
Misra, Moorthi & Dhar, 2026 — Quantum annealing for remote-sensing data processing: a review of optimization applications. link
Dent et al., 2026, Communications Engineering — Network separation modeling and quantum computing for wildfire fuelbreak strategy. link
Rainjonneau et al., 2023, IEEE JSTARS — Quantum algorithms applied to satellite mission planning for Earth observation. link
Google OR-Tools — CP-SAT solver documentation (mandatory classical baseline). link
Purnama et al., 2024 — Mediterranean forest-fire vulnerability ML in Turkiye (land cover, roads, population, weather, terrain). link
Zhang, Gao & Shi, 2025 — Lightning-ignited wildfire prediction in Texas (contrast region). link
Bountzouklis et al., 2023 — Explainable AI for wildfire ignition causes in Southern France. link
Kurchaba et al., 2022 — TROPOMI ship-plume NO2 segmentation (satellite plume ML is feasible but low-SNR). link
NIST, 2024 — FIPS 204: Module-Lattice-Based Digital Signature Standard (ML-DSA / Dilithium). link
NIST, 2024 — FIPS 203: Module-Lattice-Based Key-Encapsulation Mechanism Standard (ML-KEM / Kyber). link
Physics-Informed Graph Attention Networks for wildfire (GraphFire-X), 2025 — directed graph edges whose weights encode a physical propagation probability. arXiv:2512.20813
Physics-Informed Statistical Modeling for Wildfire Aerosols, 2022 — couples multi-source satellite streams to the advection-diffusion PDE governing plume transport. arXiv:2206.11766
CRC-SGAD: Conformal Risk Control for Supervised Graph Anomaly Detection, 2025 — distribution-free false-negative/false-positive bounds wrapped around a GNN node-anomaly score. arXiv:2504.02248
Mesogeos: a multi-purpose dataset for Mediterranean wildfire modeling, 2023 — datacube closest in geography to Sicily. Orion-AI-Lab/mesogeos
Regione Siciliana, Comando Corpo Forestale — Piano Operativo Provinciale Antincendio Boschivo (POP AIB) 2024, Agrigento. Allegato 3_1 POP AIB 2024 Agrigento.pdf
Regione Siciliana, Comando Corpo Forestale — Piano Operativo Provinciale Antincendio Boschivo (POP AIB) 2024, Catania. Allegato 3_3 POP AIB 2024 Catania.pdf
Regione Siciliana, Comando Corpo Forestale — Piano Operativo Provinciale Antincendio Boschivo (POP AIB) 2024, Palermo. Allegato 3_6 POP AIB 2024 Palermo.pdf
Radio RTM Modica — Acate: sorpreso a bruciare rifiuti speciali, denunciato dai Carabinieri, 15 July 2026. radiortm.it, 15 Jul 2026
Ragusa Oggi — Fumarole nelle campagne iblee: sette denunce e quattro siti sequestrati, 2026. ragusaoggi.it
Radio RTM Modica — Contrasto alle "fumarole" nel ragusano: sequestrata un'area di 750 mq a Vittoria, denunciati due imprenditori, 1 July 2026. radiortm.it, 1 Jul 2026
Giornale Ibleo — Acate, sorpreso a bruciare rifiuti speciali: denunciato un cittadino straniero 60enne, 15 July 2026. giornaleibleo.it, 15 Jul 2026
NASA FIRMS (Fire Information for Resource Management System) — MODIS Collection 6.1 and VIIRS 375m active-fire products, 2003–2026 archive. firms.modaps.eosdis.nasa.gov
OpenStreetMap contributors, via the Overpass API — administrative boundaries, road network, settlements, and landuse polygons for Sicily, queried 2026. openstreetmap.org/copyright (ODbL)
Joint Research Centre (JRC), European Commission — Forest Fires in Europe, Middle East and North Africa, Annual Report (JRC130846), for comparative national wildfire-cause reporting patterns across the Mediterranean. publications.jrc.ec.europa.eu, JRC130846
Wooster, M.J., Roberts, G.J., Giglio, L., Roy, D.P., et al. (2021). Satellite remote sensing of active fires: History and current status, applications and future requirements. Remote Sensing of Environment 267, 112694. doi:10.1016/j.rse.2021.112694
Miller, E.A. (2020). A Conceptual Interpretation of the Drought Code of the Canadian Forest Fire Weather Index System. Fire 3(2), 23. doi:10.3390/fire3020023
PHOENIX is a grassroots Sicily wildfire-detection project. Entries include negative and preliminary results by design. For inquiries, contact the ADR Wildfire team. Updated automatically as new entries are validated.